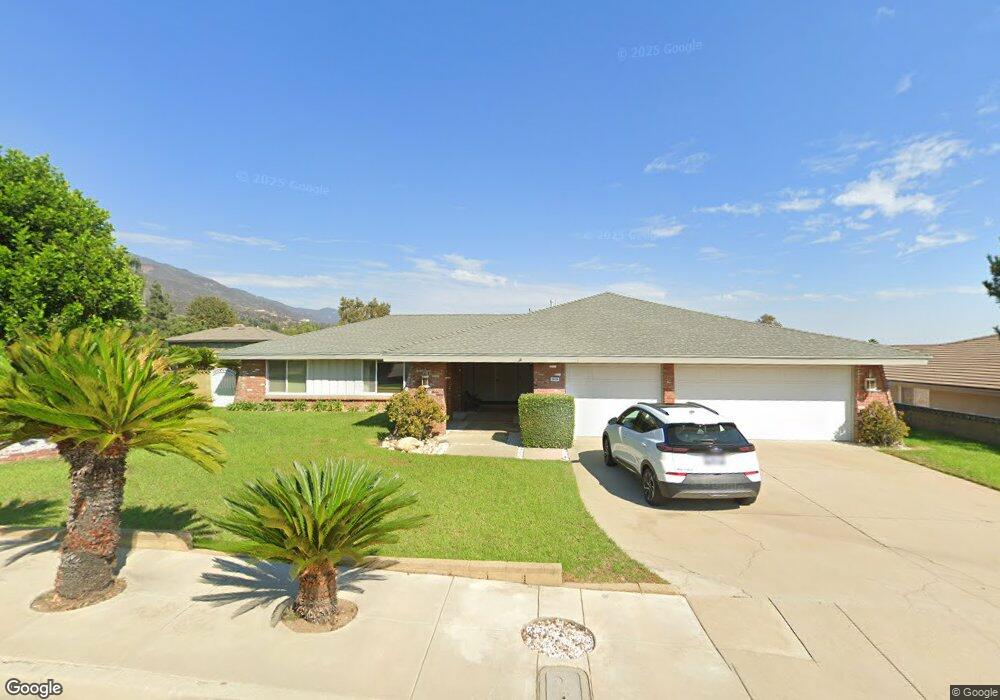
5439 Sard St Rancho Cucamonga, CA 91701
Alta Loma NeighborhoodEstimated Value: $720,000 - $1,142,000
About This Home
This home is located at 5439 Sard St, Rancho Cucamonga, CA 91701 and is currently estimated at $971,214, approximately $444 per square foot. 5439 Sard St is a home located in San Bernardino County with nearby schools including Floyd M. Stork Elementary, Alta Loma Junior High, and Alta Loma High School.
Ownership History
We collect this data history from publicly available records. To have your information removed, we recommend requesting removal directly through your county’s website.
Purchase Details
Purchase Details
Home Financials for this Owner
Home Financials are based on the most recent Mortgage that was taken out on this home.Home Values in the Area
Average Home Value in this Area
Purchase History
We collect this data history from publicly available records. To have your information removed, we recommend requesting removal directly through your county’s website.
| Date | Buyer | Sale Price | Title Company |
|---|---|---|---|
| -- | -- | ||
| $190,000 | United Title Co |
Mortgage History
We collect this data history from publicly available records. To have your information removed, we recommend requesting removal directly through your county’s website.
| Date | Status | Borrower | Loan Amount |
|---|---|---|---|
| Closed | $142,500 |
Tax History
We collect this data history from publicly available records. To have your information removed, we recommend requesting removal directly through your county’s website.
| Year | Tax Paid | Tax Assessment Tax Assessment Total Assessment is a certain percentage of the fair market value that is determined by local assessors to be the total taxable value of land and additions on the property. | Land | Improvement |
|---|---|---|---|---|
| 2025 | $1,130 | $104,768 | $14,676 | $90,092 |
| 2024 | $1,101 | $102,713 | $14,388 | $88,325 |
| 2023 | $1,076 | $100,699 | $14,106 | $86,593 |
| 2022 | $1,071 | $98,724 | $13,829 | $84,895 |
| 2021 | $1,069 | $96,788 | $13,558 | $83,230 |
| 2020 | $1,026 | $95,796 | $13,419 | $82,377 |
| 2019 | $1,036 | $93,918 | $13,156 | $80,762 |
| 2018 | $1,011 | $92,076 | $12,898 | $79,178 |
| 2017 | $965 | $90,270 | $12,645 | $77,625 |
| 2016 | $939 | $88,500 | $12,397 | $76,103 |
| 2015 | $932 | $87,171 | $12,211 | $74,960 |
| 2014 | $905 | $85,464 | $11,972 | $73,492 |
Map
- 5444 Via Serena
- 8527 Hillside Rd
- 5605 Brittany Ln
- 5645 Brittany Ln
- 8318 La Senda Rd
- 5645 Sapphire St
- 0 Bella Vista Dr Unit CV25069957
- 8714 Rancho St
- 8730 Rancho St
- 5291 Carnelian St
- 8869 Justify Dr
- 5787 Ridgeway Rd
- 7975 Pearl St
- 5259 Galloway St
- 8424 Pumalo St
- 5089 Skyline Rd
- 8992 Hillside Rd
- 5739 Indigo Ave
- 8954 Caballero Dr
- 8523 Quarter Horse Ln
Ask me questions while you tour the home.