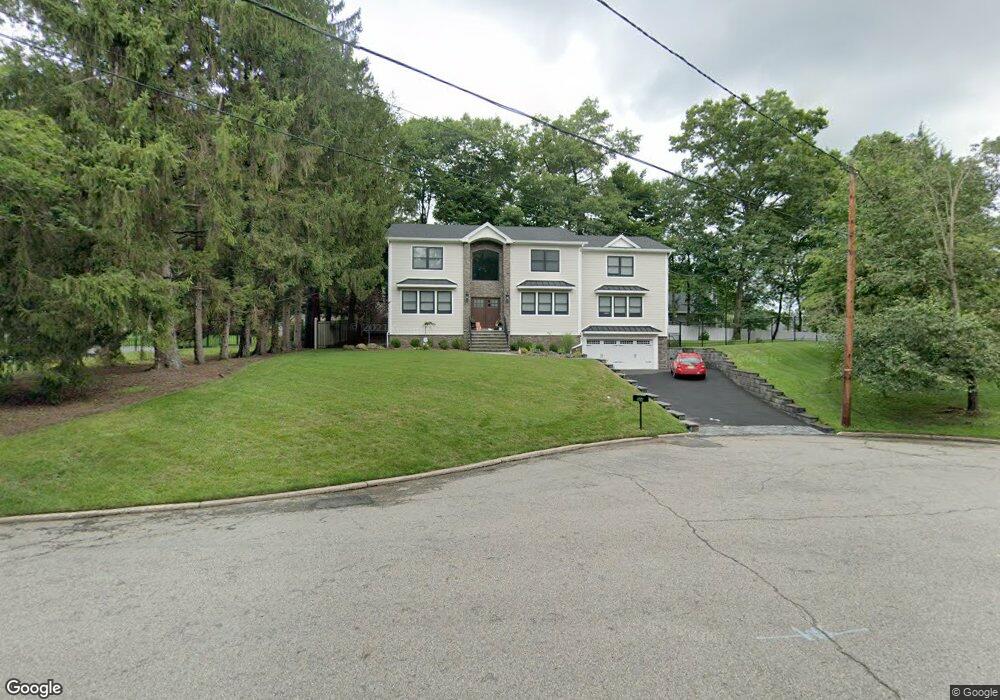
544 Buckley Ct Rivervale, NJ 07675
Estimated Value: $1,426,000 - $2,011,000
5
Beds
5
Baths
3,926
Sq Ft
$421/Sq Ft
Est. Value
About This Home
This home is located at 544 Buckley Ct, Rivervale, NJ 07675 and is currently estimated at $1,654,173, approximately $421 per square foot. 544 Buckley Ct is a home located in Bergen County with nearby schools including Pascack Valley High School, Primoris Academy, and St. John's Academy.
Ownership History
Date
Name
Owned For
Owner Type
Purchase Details
Closed on
Mar 4, 2017
Sold by
Backstreets Capital Llc
Bought by
Burne Benjamin and Allegretta Susanna
Current Estimated Value
Home Financials for this Owner
Home Financials are based on the most recent Mortgage that was taken out on this home.
Original Mortgage
$780,000
Interest Rate
3.96%
Mortgage Type
New Conventional
Purchase Details
Closed on
Dec 6, 2016
Sold by
Alpine Builders Llc
Bought by
Backstreets Capital Llc
Purchase Details
Closed on
Mar 7, 2016
Sold by
Sheriff Of Bergen County
Bought by
Alpine Builders Llc
Purchase Details
Closed on
Jan 24, 1997
Sold by
Rice Richard C
Bought by
Kang Eugene M
Home Financials for this Owner
Home Financials are based on the most recent Mortgage that was taken out on this home.
Original Mortgage
$203,000
Interest Rate
7.5%
Create a Home Valuation Report for This Property
The Home Valuation Report is an in-depth analysis detailing your home's value as well as a comparison with similar homes in the area
Home Values in the Area
Average Home Value in this Area
Purchase History
| Date | Buyer | Sale Price | Title Company |
|---|---|---|---|
| Burne Benjamin | $1,180,000 | None Available | |
| Backstreets Capital Llc | $425,000 | None Available | |
| Alpine Builders Llc | $377,000 | Attorney | |
| Kang Eugene M | $254,000 | -- |
Source: Public Records
Mortgage History
| Date | Status | Borrower | Loan Amount |
|---|---|---|---|
| Previous Owner | Burne Benjamin | $780,000 | |
| Previous Owner | Kang Eugene M | $203,000 | |
| Closed | Alpine Builders Llc | $0 |
Source: Public Records
Tax History Compared to Growth
Tax History
| Year | Tax Paid | Tax Assessment Tax Assessment Total Assessment is a certain percentage of the fair market value that is determined by local assessors to be the total taxable value of land and additions on the property. | Land | Improvement |
|---|---|---|---|---|
| 2025 | $27,310 | $1,000,000 | $331,900 | $668,100 |
| 2024 | $27,140 | $1,000,000 | $331,900 | $668,100 |
| 2023 | $28,981 | $1,000,000 | $331,900 | $668,100 |
| 2022 | $28,981 | $1,095,700 | $331,900 | $763,800 |
| 2021 | $28,302 | $1,095,700 | $331,900 | $763,800 |
| 2020 | $28,631 | $1,095,700 | $331,900 | $763,800 |
| 2019 | $27,973 | $1,095,700 | $331,900 | $763,800 |
| 2018 | $27,666 | $1,095,700 | $331,900 | $763,800 |
| 2017 | $11,248 | $452,100 | $331,900 | $120,200 |
| 2016 | $10,927 | $452,100 | $331,900 | $120,200 |
| 2015 | $10,615 | $452,100 | $331,900 | $120,200 |
| 2014 | $10,272 | $452,100 | $331,900 | $120,200 |
Source: Public Records
Map
Nearby Homes
- 521 Piermont Ave S Unit 428A
- 521 Piermont Ave S Unit 417A
- 30 Homestead St
- 458 Cedar Ln
- 410 Mark Ln
- 6 Augusta Way
- 8 Augusta Way
- 23 Muirfield Ln
- 229 William St
- 21 Muirfield Ln
- 87 Woodmont Cir
- 4 Royal Birkdale Ct
- 25 Muirfield Ln
- Balmore Plan at The Fairways at Edgewood - Carriages Collection
- 258 Rivervale Rd
- 179 Woodmont Cir
- 13 Royal Birkdale Ln
- 9 Appeld Ct
- 7 & 11 Stokes Farm Rd
- 502 Westwood Ave
- 548 Buckley Ct
- 555 Brook Ave
- 540 Buckley Ct
- 551 Brook Ave
- 559 Brook Ave
- 563 Echo Glen Ave
- 340 Sabin Place
- 541 Buckley Ct
- 536 Buckley Ct
- 547 Brook Ave
- 546 Brook Ave
- 344 Sabin Place
- 563 Brook Ave
- 336 Sabin Place
- 320 Perry Place
- 567 Echo Glen Ave
- 560 Brook Ave
- 543 Brook Ave
- 332 Sabin Place
- 348 Sabin Place