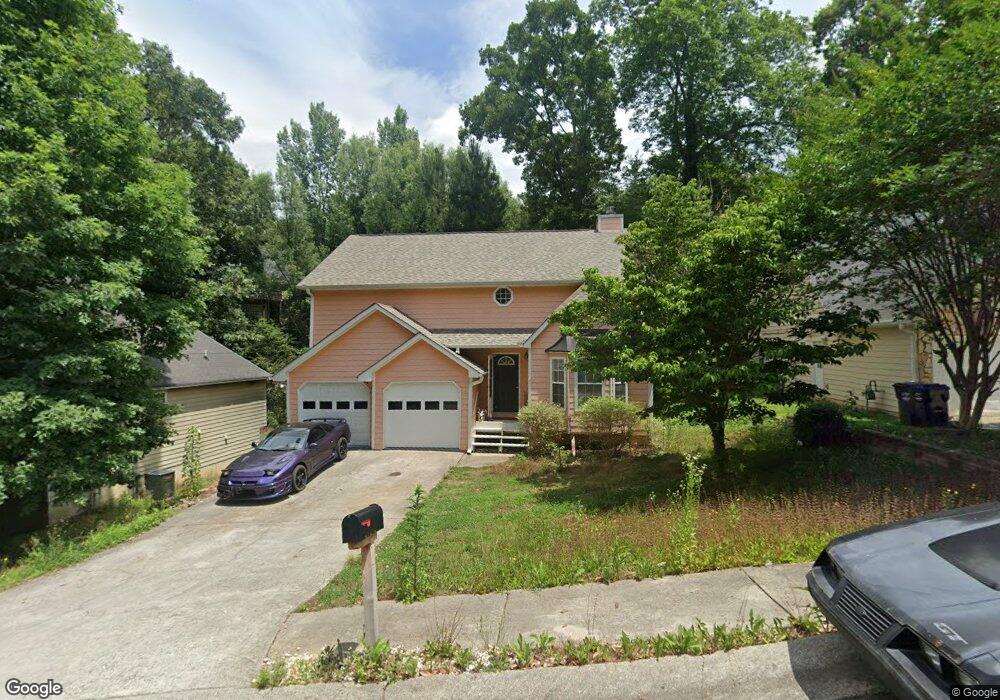
544 Cherokee Overlook Ct Unit 3 Canton, GA 30115
Estimated Value: $318,000 - $368,099
3
Beds
3
Baths
2,372
Sq Ft
$145/Sq Ft
Est. Value
About This Home
This home is located at 544 Cherokee Overlook Ct Unit 3, Canton, GA 30115 and is currently estimated at $343,050, approximately $144 per square foot. 544 Cherokee Overlook Ct Unit 3 is a home located in Cherokee County with nearby schools including Indian Knoll Elementary School, Rusk Middle School, and Sequoyah High School.
Ownership History
Date
Name
Owned For
Owner Type
Purchase Details
Closed on
Aug 27, 2018
Sold by
Parks Wayman
Bought by
Offerpad Spvborrower Llc
Current Estimated Value
Purchase Details
Closed on
Jun 25, 2004
Sold by
Seavey Beth
Bought by
Parks Wayman
Home Financials for this Owner
Home Financials are based on the most recent Mortgage that was taken out on this home.
Original Mortgage
$128,484
Interest Rate
6.25%
Mortgage Type
VA
Purchase Details
Closed on
Aug 11, 2000
Sold by
Chastain Rick
Bought by
Seavey Beth
Home Financials for this Owner
Home Financials are based on the most recent Mortgage that was taken out on this home.
Original Mortgage
$94,500
Interest Rate
8.07%
Mortgage Type
New Conventional
Create a Home Valuation Report for This Property
The Home Valuation Report is an in-depth analysis detailing your home's value as well as a comparison with similar homes in the area
Home Values in the Area
Average Home Value in this Area
Purchase History
| Date | Buyer | Sale Price | Title Company |
|---|---|---|---|
| Offerpad Spvborrower Llc | $152,500 | -- | |
| Parks Wayman | $129,500 | -- | |
| Seavey Beth | $105,100 | -- |
Source: Public Records
Mortgage History
| Date | Status | Borrower | Loan Amount |
|---|---|---|---|
| Previous Owner | Parks Wayman | $128,484 | |
| Previous Owner | Seavey Beth | $94,500 |
Source: Public Records
Tax History Compared to Growth
Tax History
| Year | Tax Paid | Tax Assessment Tax Assessment Total Assessment is a certain percentage of the fair market value that is determined by local assessors to be the total taxable value of land and additions on the property. | Land | Improvement |
|---|---|---|---|---|
| 2025 | $3,865 | $134,320 | $13,974 | $120,346 |
| 2024 | $3,845 | $134,320 | $13,974 | $120,346 |
| 2023 | $3,845 | $134,320 | $13,974 | $120,346 |
| 2022 | $3,157 | $110,000 | $11,520 | $98,480 |
| 2021 | $2,704 | $88,680 | $8,640 | $80,040 |
| 2020 | $1,832 | $60,006 | $7,680 | $52,326 |
| 2019 | $1,833 | $60,000 | $7,680 | $52,320 |
| 2018 | $1,704 | $58,200 | $7,200 | $51,000 |
| 2017 | $1,237 | $138,800 | $7,200 | $48,320 |
| 2016 | $1,237 | $126,700 | $6,000 | $44,680 |
| 2015 | $1,071 | $109,600 | $5,280 | $38,560 |
| 2014 | $1,215 | $99,500 | $4,800 | $35,000 |
Source: Public Records
Map
Nearby Homes
- 3789 Cherokee Overlook Dr
- 809 Overlook Trail
- 832 Overlook Trail
- 254 Hillcrest Ridge Unit 2
- 3714 Cherokee Overlook Dr Unit 2
- 312 Hillcrest Ln
- 201 Hillcrest Ridge
- 231 Breeze Hill Ln
- 209 Forest Trace
- 3548 Cherokee Overlook Dr
- 0 Reed St Unit 7646438
- 701 Longview Dr
- 120 Jeanette St
- 365 Russell King Ln
- 0 Governors Walk Dr Unit 7294252
- 302 and 304 Garland Way
- 240 Rose Ridge Dr
- 727 Lower Scott Mill Rd
- 120 E Killian St
- 5916 Governors Walk Dr
- 546 Cherokee Overlook Ct
- 546 Cherokee Overlook Ct Unit 38
- 542 Cherokee Overlook Ct
- 542 Cherokee Overlook Ct
- 542 Cherokee Overlook Ct Unit 542
- 540 Cherokee Overlook Ct
- 800 Overlook Trail
- 548 Cherokee Overlook Ct
- 804 Overlook Trail
- 804 Overlook Trail Unit 45
- 541 Cherokee Overlook Ct
- 806 Overlook Trail
- 539 Cherokee Overlook Ct Unit III
- 543 Cherokee Overlook Ct
- 538 Cherokee Overlook Ct Unit 3
- 537 Cherokee Overlook Ct Unit III
- 545 Cherokee Overlook Ct
- 801 Overlook Trail
- 808 Overlook Trail
- 535 Cherokee Overlook Ct