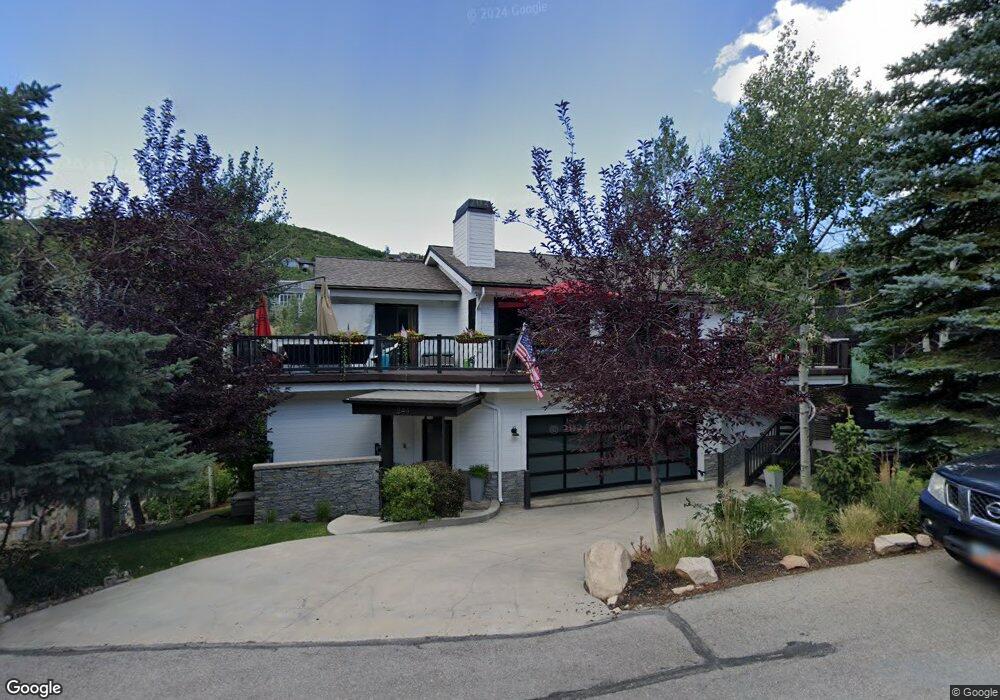
544 Deer Valley Loop Unit A Park City, UT 84060
Deer Valley NeighborhoodEstimated Value: $1,132,000 - $1,800,000
3
Beds
2
Baths
1,239
Sq Ft
$1,158/Sq Ft
Est. Value
About This Home
This home is located at 544 Deer Valley Loop Unit A, Park City, UT 84060 and is currently estimated at $1,434,801, approximately $1,158 per square foot. 544 Deer Valley Loop Unit A is a home located in Summit County with nearby schools including McPolin Elementary School, Treasure Mountain Junior High School, and Ecker Hill Middle School.
Ownership History
Date
Name
Owned For
Owner Type
Purchase Details
Closed on
Nov 8, 2021
Sold by
Putman Benjamin and Mcshane Paul J
Bought by
544Dvl Llc
Current Estimated Value
Purchase Details
Closed on
Aug 20, 2021
Sold by
Putman Benjamin and Mcshane Paul J
Bought by
344 Dvl Llc
Home Financials for this Owner
Home Financials are based on the most recent Mortgage that was taken out on this home.
Original Mortgage
$400,000
Interest Rate
2.9%
Mortgage Type
New Conventional
Purchase Details
Closed on
Sep 11, 2017
Sold by
Wilsey Michael
Bought by
Putman Benjamin and Burk William
Home Financials for this Owner
Home Financials are based on the most recent Mortgage that was taken out on this home.
Original Mortgage
$476,250
Interest Rate
3.89%
Mortgage Type
New Conventional
Purchase Details
Closed on
Oct 15, 2014
Sold by
Mountain Top Release Inc
Bought by
Wilsey Michael
Create a Home Valuation Report for This Property
The Home Valuation Report is an in-depth analysis detailing your home's value as well as a comparison with similar homes in the area
Home Values in the Area
Average Home Value in this Area
Purchase History
| Date | Buyer | Sale Price | Title Company |
|---|---|---|---|
| 544Dvl Llc | -- | First American Title Ins Co | |
| 344 Dvl Llc | -- | Accommodation | |
| Putman Benjamin | -- | First American | |
| Putman Benjamin | -- | First Amer Title Ins Co | |
| Wilsey Michael | -- | First American Title Co Llc |
Source: Public Records
Mortgage History
| Date | Status | Borrower | Loan Amount |
|---|---|---|---|
| Previous Owner | Putman Benjamin | $400,000 | |
| Previous Owner | Putman Benjamin | $476,250 |
Source: Public Records
Tax History Compared to Growth
Tax History
| Year | Tax Paid | Tax Assessment Tax Assessment Total Assessment is a certain percentage of the fair market value that is determined by local assessors to be the total taxable value of land and additions on the property. | Land | Improvement |
|---|---|---|---|---|
| 2024 | $9,780 | $1,115,100 | -- | $1,115,100 |
| 2023 | $9,780 | $1,734,600 | $0 | $1,734,600 |
| 2022 | $3,590 | $545,000 | $200,000 | $345,000 |
| 2021 | $4,153 | $545,000 | $200,000 | $345,000 |
| 2020 | $4,409 | $545,000 | $200,000 | $345,000 |
| 2019 | $4,486 | $545,000 | $200,000 | $345,000 |
| 2018 | $4,486 | $545,000 | $200,000 | $345,000 |
| 2017 | $4,262 | $545,000 | $200,000 | $345,000 |
| 2016 | $3,414 | $425,000 | $80,000 | $345,000 |
| 2015 | $3,774 | $445,000 | $0 | $0 |
| 2013 | $2,226 | $244,750 | $0 | $0 |
Source: Public Records
Map
Nearby Homes
- 552 Deer Valley Dr
- 560 Deer Valley Dr
- 751 Rossie Hill Dr
- 755 Rossie Hill Dr
- 347 Mchenry St
- 347 Mchenry Ave
- 741 Rossie Hill Dr
- 658 Rossie Hill Dr Unit 3
- 335 Ontario Ave
- 690 Deer Valley Dr Unit 11
- 320 Marsac Ave
- 235 Mchenry St
- 580 Main St Unit 309
- 580 Main St Unit 408
- 333 Main St Unit 10
- 333 Main St Unit 23
- 1164 Stonebridge Cir
- 544 Deer Valley Loop Rd
- 544 Deer Valley Loop Rd Unit A
- 544 Deer Valley Loop Unit C
- 544 Deer Valley Loop
- 544 Deer Valley Loop Unit B
- 544 Deer Valley Dr Unit B
- 544 Deer Valley Dr Unit A
- 537 Deer Valley Loop Rd Unit 537
- 543 Deer Valley Loop Rd
- 522 Deer Valley Drive (Caribou Lod
- 566 Deer Valley Loop Rd
- 1 Deer Valley Loop Rd
- 0 Deer Valley Loop Rd Unit 9701621
- 0 Deer Valley Loop Rd Unit 9700790
- 412 Deer Valley Loop Rd
- 408 Deer Valley Loop Rd
- 0 Deer Valley Loop Rd Unit 9962962
- 0 Deer Valley Loop Rd Unit 158-A 9600101
- 0 Deer Valley Loop Rd Unit 158-A 9600102
- 0 Deer Valley Loop Rd Unit 601 9962508