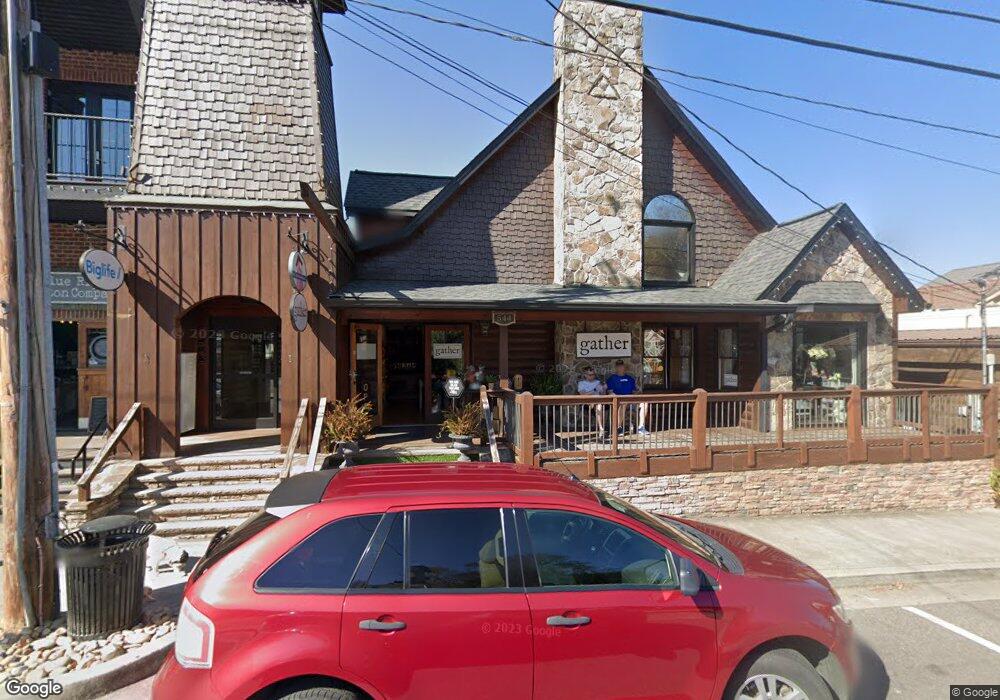
544 E Main St Unit 2 Blue Ridge, GA 30513
Estimated Value: $2,290,357
3
Beds
3
Baths
1,960
Sq Ft
$1,169/Sq Ft
Est. Value
About This Home
This home is located at 544 E Main St Unit 2, Blue Ridge, GA 30513 and is currently estimated at $2,290,357, approximately $1,168 per square foot. 544 E Main St Unit 2 is a home located in Fannin County with nearby schools including Fannin County High School and Fannin Christian Learning Center.
Ownership History
Date
Name
Owned For
Owner Type
Purchase Details
Closed on
Sep 30, 2021
Sold by
Queen & Court Llc
Bought by
Building At Blue Ridge Llc
Current Estimated Value
Purchase Details
Closed on
Jan 31, 2017
Bought by
Lofts On Main Llc
Purchase Details
Closed on
Jun 12, 2009
Sold by
Gemstones Llc
Bought by
Queen & Court Llc
Purchase Details
Closed on
Nov 29, 2004
Sold by
Carroll Holding Llc
Bought by
Gemstones L L C
Purchase Details
Closed on
May 21, 2004
Sold by
Carroll Holding Llc
Bought by
Gemstones L L C
Purchase Details
Closed on
Mar 31, 2001
Sold by
Carroll Development
Bought by
Carroll Holding Llc
Purchase Details
Closed on
Sep 14, 2000
Sold by
Carroll Thomas S
Bought by
Carroll Development
Purchase Details
Closed on
Sep 23, 1998
Sold by
Tipton William B
Bought by
Gpt Enterprises Llc
Purchase Details
Closed on
Jan 24, 1989
Bought by
Tipton William B
Create a Home Valuation Report for This Property
The Home Valuation Report is an in-depth analysis detailing your home's value as well as a comparison with similar homes in the area
Home Values in the Area
Average Home Value in this Area
Purchase History
| Date | Buyer | Sale Price | Title Company |
|---|---|---|---|
| Building At Blue Ridge Llc | $1,850,000 | -- | |
| Lofts On Main Llc | -- | -- | |
| Queen & Court Llc | $900,000 | -- | |
| Gemstones L L C | -- | -- | |
| Gemstones L L C | $650,000 | -- | |
| Carroll Holding Llc | -- | -- | |
| Carroll Development | -- | -- | |
| Carroll Thomas S | $85,000 | -- | |
| Gpt Enterprises Llc | -- | -- | |
| Tipton William B | -- | -- |
Source: Public Records
Tax History Compared to Growth
Tax History
| Year | Tax Paid | Tax Assessment Tax Assessment Total Assessment is a certain percentage of the fair market value that is determined by local assessors to be the total taxable value of land and additions on the property. | Land | Improvement |
|---|---|---|---|---|
| 2025 | $4,411 | $339,516 | $71,008 | $268,508 |
| 2024 | $4,411 | $339,516 | $71,008 | $268,508 |
| 2023 | $4,837 | $339,516 | $71,008 | $268,508 |
| 2022 | $3,461 | $339,516 | $71,008 | $268,508 |
| 2021 | $4,549 | $324,474 | $108,000 | $216,474 |
| 2020 | $4,625 | $324,474 | $108,000 | $216,474 |
| 2019 | $4,715 | $324,474 | $108,000 | $216,474 |
| 2018 | $4,433 | $287,744 | $108,000 | $179,744 |
| 2017 | $6,717 | $289,860 | $108,000 | $181,860 |
Source: Public Records
Map
Nearby Homes
- 116 W Main St
- 116 W Main St Unit STE 2A
- 116 W Main St Unit 2A
- 0 Grove Loop Unit 47
- 154 Mountain St
- LT 19 E 2nd St
- 685 E Main St
- 685 E Main St Unit B
- 477 W First St
- 12 Mountain St
- 1 E Main St
- Lot 2 Ridges of Blue Ridge
- 330 E Second St
- 225 Grand Vista Dr
- Lot 12 The Heights
- 100 Haven Ln Unit 5
- 2 & 2A Weymans Way
- Lot 1 Saratoga Haven
- Lot C6 Briar Woods Ln
- 51 Grove Loop
- 544 E Main St
- 544 E Main Street #2
- 550 Main Street #300
- 534 E Main St
- 560 E Main St
- 576 E Main St
- 500 E Main St Unit 11-13
- 500 E Main St
- 0 Messer St Unit Lot Tract A 314042
- 511 E Main St
- 50 W Main St
- 530 E Main St
- 550 E Main St
- 550 E Main St Unit 300
- 550 E Main St
- 588 E Main St
- 505 E Main St
- 505 E Main St Unit Lot 278
- 594 E Main St
- 521 E Main St