Estimated Value: $280,361 - $302,000
3
Beds
2
Baths
1,532
Sq Ft
$191/Sq Ft
Est. Value
About This Home
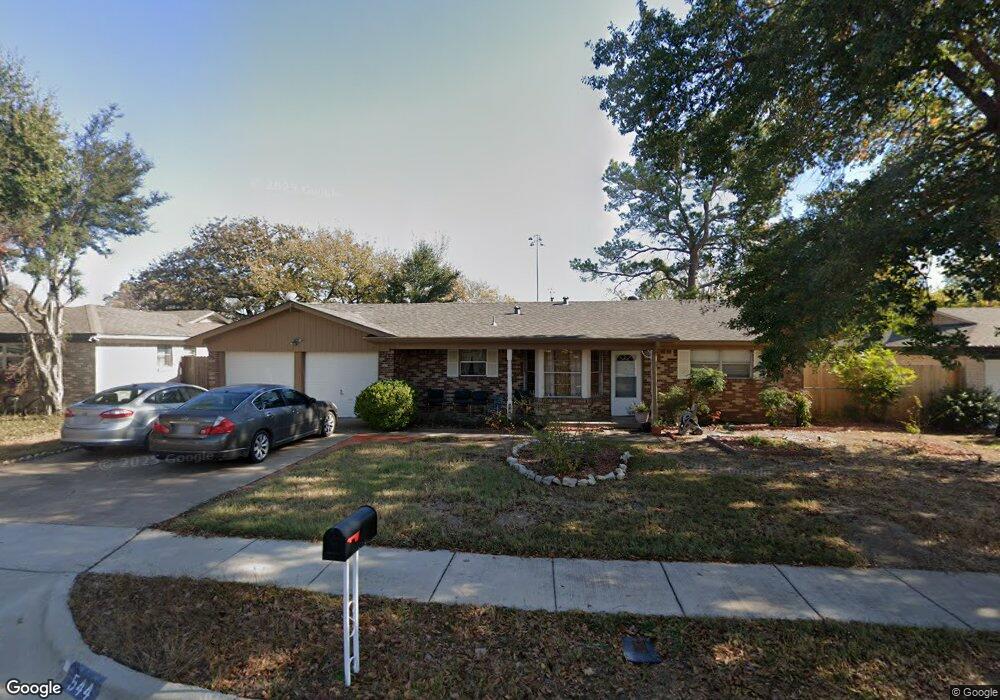
This home is located at 544 E Redbud Dr, Hurst, TX 76053 and is currently estimated at $292,090, approximately $190 per square foot. 544 E Redbud Dr is a home located in Tarrant County with nearby schools including Bellaire Elementary School, Hurst J High School, and L.D. Bell High School.
Ownership History
Date
Name
Owned For
Owner Type
Purchase Details
Closed on
Jun 27, 1997
Sold by
Smith Hulin H and Smith Patricia Ann
Bought by
Wordsworth Byrle N and Wordsworth Elizabeth D
Current Estimated Value
Home Financials for this Owner
Home Financials are based on the most recent Mortgage that was taken out on this home.
Original Mortgage
$78,937
Outstanding Balance
$11,735
Interest Rate
7.92%
Estimated Equity
$280,355
Create a Home Valuation Report for This Property
The Home Valuation Report is an in-depth analysis detailing your home's value as well as a comparison with similar homes in the area
Home Values in the Area
Average Home Value in this Area
Purchase History
| Date | Buyer | Sale Price | Title Company |
|---|---|---|---|
| Wordsworth Byrle N | -- | Alamo Title Co |
Source: Public Records
Mortgage History
| Date | Status | Borrower | Loan Amount |
|---|---|---|---|
| Open | Wordsworth Byrle N | $78,937 |
Source: Public Records
Tax History
| Year | Tax Paid | Tax Assessment Tax Assessment Total Assessment is a certain percentage of the fair market value that is determined by local assessors to be the total taxable value of land and additions on the property. | Land | Improvement |
|---|---|---|---|---|
| 2025 | $551 | $261,018 | $55,000 | $206,018 |
| 2024 | $551 | $261,018 | $55,000 | $206,018 |
| 2023 | $3,663 | $254,060 | $40,000 | $214,060 |
| 2022 | $3,827 | $239,059 | $40,000 | $199,059 |
| 2021 | $3,645 | $185,890 | $40,000 | $145,890 |
| 2020 | $3,305 | $164,000 | $40,000 | $124,000 |
| 2019 | $3,057 | $172,145 | $40,000 | $132,145 |
| 2018 | $1,036 | $113,534 | $19,000 | $94,534 |
| 2017 | $2,612 | $149,350 | $19,000 | $130,350 |
| 2016 | $2,374 | $123,774 | $19,000 | $104,774 |
| 2015 | $1,859 | $85,300 | $17,000 | $68,300 |
| 2014 | $1,859 | $85,300 | $17,000 | $68,300 |
Source: Public Records
Map
Nearby Homes
- 42 Page St
- 413 Wanda Way
- 740 Shady Ln
- 308 Wanda Way
- 552 Norwood Dr
- 705 Timbercreek Dr
- 609 Norwood Dr
- 1302 Woodridge Cir
- 260 Corinna Ct
- 212 E Ellen Ave
- 108 Donald Dr
- 408 Harrison Ln
- 312 E Ellen Ave
- 205 Corinna Ct
- 802 Brown Trail
- 701 Harrison Ln
- 803 Glenda Dr
- 47 Donald Ct
- 4106 Hollow Oak Dr
- 231 Elm St
- 540 E Redbud Dr
- 548 E Redbud Dr
- 536 E Redbud Dr
- 537 E Redbud Dr
- 533 E Redbud Dr
- 329 Tanglewood Dr
- 529 E Redbud Dr
- 532 E Redbud Dr
- 333 Tanglewood Dr
- 316 Tanglewood Dr
- 325 Tanglewood Dr
- 321 Tanglewood Dr
- 525 E Redbud Dr
- 528 E Redbud Dr
- 312 Tanglewood Dr
- 317 Tanglewood Dr
- 520 Brown Trail Ct
- 521 E Redbud Dr
- 501 Greenway Dr
- 516 Brown Trail Ct
Your Personal Tour Guide
Ask me questions while you tour the home.