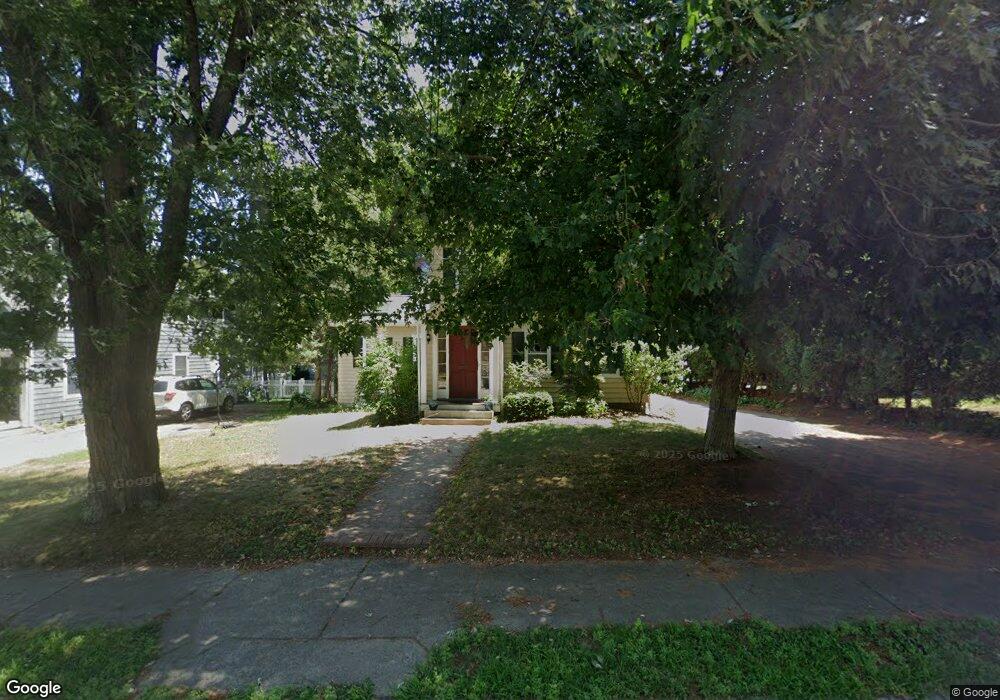
544 Grove St Newton Lower Falls, MA 02462
Newton Lower Falls NeighborhoodEstimated Value: $1,911,000 - $2,220,000
4
Beds
3
Baths
3,612
Sq Ft
$556/Sq Ft
Est. Value
About This Home
This home is located at 544 Grove St, Newton Lower Falls, MA 02462 and is currently estimated at $2,009,240, approximately $556 per square foot. 544 Grove St is a home located in Middlesex County with nearby schools including Williams Elementary School, Angier Elementary School, and Charles E Brown Middle School.
Ownership History
Date
Name
Owned For
Owner Type
Purchase Details
Closed on
Jul 22, 2022
Sold by
Sisenwine Heidi
Bought by
Sisenwine Joel
Current Estimated Value
Purchase Details
Closed on
May 30, 2000
Sold by
Daylor Susan R
Bought by
Sisenwine Joel and Sisenwine Heidi
Create a Home Valuation Report for This Property
The Home Valuation Report is an in-depth analysis detailing your home's value as well as a comparison with similar homes in the area
Home Values in the Area
Average Home Value in this Area
Purchase History
| Date | Buyer | Sale Price | Title Company |
|---|---|---|---|
| Sisenwine Joel | -- | None Available | |
| Sisenwine Joel | $645,000 | -- |
Source: Public Records
Mortgage History
| Date | Status | Borrower | Loan Amount |
|---|---|---|---|
| Previous Owner | Sisenwine Joel | $398,000 | |
| Previous Owner | Sisenwine Joel | $417,000 |
Source: Public Records
Tax History Compared to Growth
Tax History
| Year | Tax Paid | Tax Assessment Tax Assessment Total Assessment is a certain percentage of the fair market value that is determined by local assessors to be the total taxable value of land and additions on the property. | Land | Improvement |
|---|---|---|---|---|
| 2025 | $16,829 | $1,717,200 | $915,200 | $802,000 |
| 2024 | $16,272 | $1,667,200 | $888,500 | $778,700 |
| 2023 | $15,523 | $1,524,900 | $704,100 | $820,800 |
| 2022 | $14,853 | $1,411,900 | $651,900 | $760,000 |
| 2021 | $14,332 | $1,332,000 | $615,000 | $717,000 |
| 2020 | $13,906 | $1,332,000 | $615,000 | $717,000 |
| 2019 | $13,514 | $1,293,200 | $597,100 | $696,100 |
| 2018 | $13,033 | $1,204,500 | $526,900 | $677,600 |
| 2017 | $12,636 | $1,136,300 | $497,100 | $639,200 |
| 2016 | $12,086 | $1,062,000 | $464,600 | $597,400 |
| 2015 | $11,523 | $992,500 | $434,200 | $558,300 |
Source: Public Records
Map
Nearby Homes
- 45 Moulton St
- 17 Deforest Rd
- 25 Columbia St
- 2084 Washington St
- 45 E Quinobequin Rd
- 7 Crescent St
- 34 Palmer Rd
- 177 Varick Rd
- 27 Oakwood Rd
- 10 Lorraine Cir
- 2 Longfellow Rd
- 12 Bird Hill Ave
- 8 Old Town Rd
- 33 Metacomet Rd
- 17 Lasell St
- 41 Orchard Ave
- 1801 Beacon St
- 283 Woodland Rd
- 1754 Washington St
- 20 Oakland Street Front
- 540 Grove St
- 554F Grove St
- 554 Grove St
- 558 Grove St
- 548 Grove St
- 6 Blueberry Cir
- 11 Blueberry Cir
- 126 Cornell St
- 566 Grove St
- 14 Blueberry Cir
- 522 Grove St
- 10 Blueberry Cir
- 132 Cornell St Unit 134
- 5 Pine Grove Ave
- 516 Grove St
- 110 Moulton St
- 574 Grove St Unit 576
- 574 Grove St
- 121 Cornell St
- 117 Moulton St