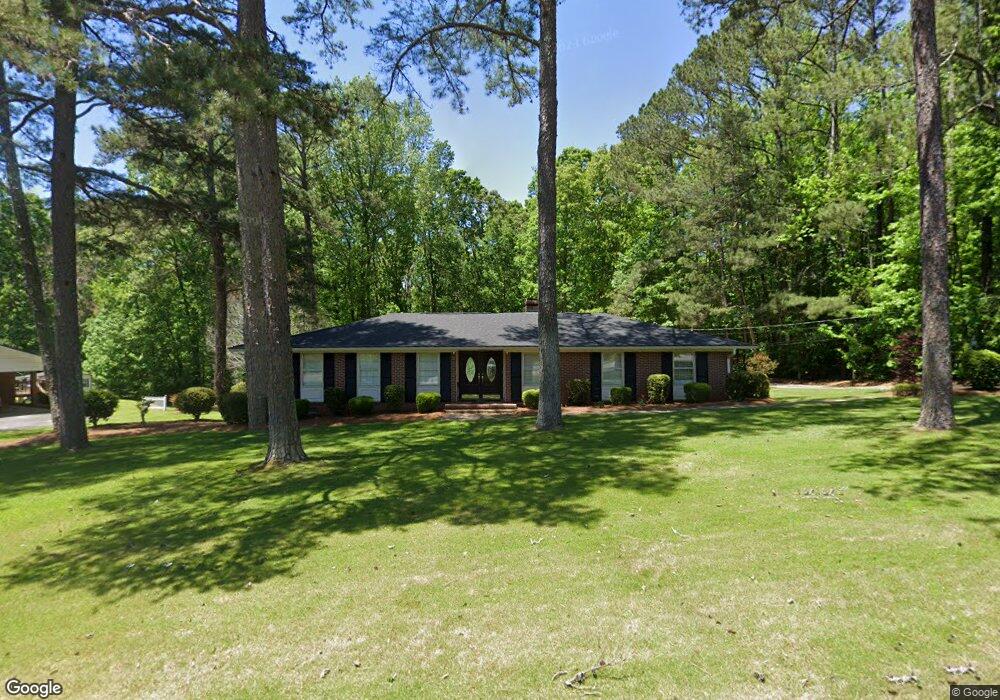
544 Rhodes Dr Elberton, GA 30635
Estimated Value: $241,103 - $323,000
--
Bed
2
Baths
2,379
Sq Ft
$120/Sq Ft
Est. Value
About This Home
This home is located at 544 Rhodes Dr, Elberton, GA 30635 and is currently estimated at $286,276, approximately $120 per square foot. 544 Rhodes Dr is a home located in Elbert County with nearby schools including Elbert County Elementary School, Elbert County Primary School, and Elbert County Middle School.
Ownership History
Date
Name
Owned For
Owner Type
Purchase Details
Closed on
Oct 19, 2020
Sold by
Fortson Donald Shannon
Bought by
Cone Stewart
Current Estimated Value
Home Financials for this Owner
Home Financials are based on the most recent Mortgage that was taken out on this home.
Original Mortgage
$189,050
Outstanding Balance
$167,843
Interest Rate
2.8%
Mortgage Type
New Conventional
Estimated Equity
$118,433
Purchase Details
Closed on
Apr 27, 2020
Sold by
Fleischer Angela A
Bought by
Smith Leann Cook and Fortson Donald Shannon
Purchase Details
Closed on
Apr 7, 2014
Sold by
Fleischer John Gregory
Bought by
Fleischer Angela A
Purchase Details
Closed on
Nov 1, 1996
Purchase Details
Closed on
Sep 1, 1977
Purchase Details
Closed on
May 1, 1964
Purchase Details
Closed on
Jan 1, 1961
Create a Home Valuation Report for This Property
The Home Valuation Report is an in-depth analysis detailing your home's value as well as a comparison with similar homes in the area
Home Values in the Area
Average Home Value in this Area
Purchase History
| Date | Buyer | Sale Price | Title Company |
|---|---|---|---|
| Cone Stewart | $199,000 | -- | |
| Smith Leann Cook | $150,000 | -- | |
| Fleischer Angela A | -- | -- | |
| -- | -- | -- | |
| -- | -- | -- | |
| -- | $4,400 | -- | |
| -- | -- | -- |
Source: Public Records
Mortgage History
| Date | Status | Borrower | Loan Amount |
|---|---|---|---|
| Open | Cone Stewart | $189,050 |
Source: Public Records
Tax History Compared to Growth
Tax History
| Year | Tax Paid | Tax Assessment Tax Assessment Total Assessment is a certain percentage of the fair market value that is determined by local assessors to be the total taxable value of land and additions on the property. | Land | Improvement |
|---|---|---|---|---|
| 2024 | $2,699 | $109,690 | $12,000 | $97,690 |
| 2023 | $2,699 | $109,690 | $12,000 | $97,690 |
| 2022 | $1,781 | $72,375 | $12,000 | $60,375 |
| 2021 | $1,794 | $72,375 | $12,000 | $60,375 |
| 2020 | $1,391 | $55,810 | $12,000 | $43,810 |
| 2019 | $1,432 | $55,810 | $12,000 | $43,810 |
| 2018 | $1,460 | $55,810 | $12,000 | $43,810 |
| 2017 | $1,465 | $52,320 | $12,000 | $40,320 |
| 2016 | $1,370 | $52,064 | $12,000 | $40,064 |
| 2015 | -- | $52,064 | $12,000 | $40,064 |
| 2014 | -- | $52,064 | $12,000 | $40,064 |
| 2013 | -- | $52,064 | $12,000 | $40,064 |
Source: Public Records
Map
Nearby Homes
- 0 Rhodes Dr Unit 10455518
- 270 Dogwood Ln
- 143 Lake Forest Cir
- 415 Athenia St
- 0 Mineral Springs Rd Unit 10455464
- 0 Mineral Springs Rd Unit 10455495
- 0 Mineral Springs Rd Unit 10455479
- 0 Oak Dr Unit 7643600
- 0 Oak Dr Unit 10598083
- 170 Lake Forest Dr
- 118 Oak Dr
- 108 Brookhaven Cir
- 196 S Oliver St
- 62 Oak St
- 136 Forest Ave
- 2790 Cedar Creek Rd
- 89 College Ave
- 115 S Thomas St
- 252 Edwards St
- 105 S Thomas St
- 550 Rhodes Dr
- 538 Rhodes Dr
- 543 Rhodes Dr
- 545 Rhodes Dr
- 554 Rhodes Dr
- 539 Rhodes Dr
- 536 Rhodes Dr
- 547 Rhodes Dr
- 535 Rhodes Dr
- 558 Rhodes Dr
- 534 Rhodes Dr
- 562 Rhodes Dr
- 0 Rhodes Dr Unit 10244197
- 0 Rhodes Dr Unit 20096019
- 0 Rhodes Dr Unit 20057012
- 521a & 521b Rhodes Dr
- 521 Rhodes Dr
- 555 Rhodes Dr
- 533 Rhodes Dr
- 530 Rhodes Dr