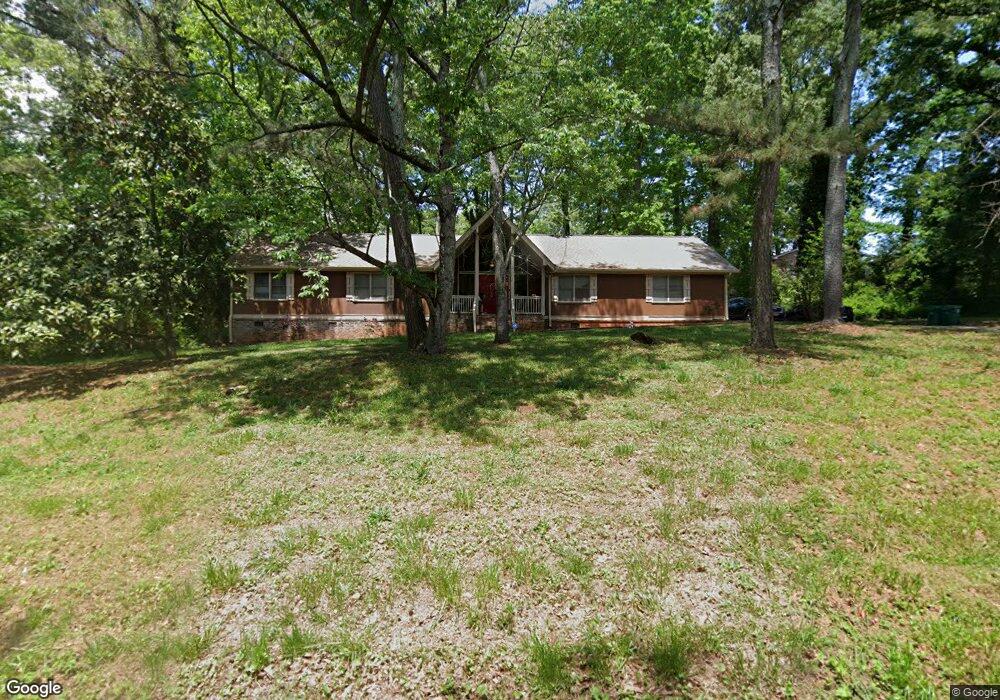
5440 Oquinn Ct Unit 44 Stone Mountain, GA 30088
Estimated Value: $252,459 - $280,000
4
Beds
3
Baths
1,845
Sq Ft
$145/Sq Ft
Est. Value
About This Home
This home is located at 5440 Oquinn Ct Unit 44, Stone Mountain, GA 30088 and is currently estimated at $267,115, approximately $144 per square foot. 5440 Oquinn Ct Unit 44 is a home located in DeKalb County with nearby schools including Rockbridge Elementary School, Stone Mountain Middle School, and Stone Mountain High School.
Ownership History
Date
Name
Owned For
Owner Type
Purchase Details
Closed on
Jul 8, 2022
Sold by
Wilson Natalie
Bought by
Knowles Natalie and Knowles William
Current Estimated Value
Home Financials for this Owner
Home Financials are based on the most recent Mortgage that was taken out on this home.
Original Mortgage
$134,000
Outstanding Balance
$127,457
Interest Rate
5.23%
Mortgage Type
New Conventional
Estimated Equity
$139,658
Purchase Details
Closed on
Sep 26, 2014
Sold by
Ara Ventures Llc
Bought by
Wilson Natalie
Home Financials for this Owner
Home Financials are based on the most recent Mortgage that was taken out on this home.
Original Mortgage
$89,133
Interest Rate
4.25%
Mortgage Type
FHA
Purchase Details
Closed on
Feb 8, 2012
Sold by
Mitchell Patricia L
Bought by
Ara Ventures Llc
Purchase Details
Closed on
Aug 15, 1996
Sold by
Kelley Maureen Ann
Bought by
Mitchell Patricia
Create a Home Valuation Report for This Property
The Home Valuation Report is an in-depth analysis detailing your home's value as well as a comparison with similar homes in the area
Home Values in the Area
Average Home Value in this Area
Purchase History
| Date | Buyer | Sale Price | Title Company |
|---|---|---|---|
| Knowles Natalie | -- | -- | |
| Wilson Natalie | $94,900 | -- | |
| Ara Ventures Llc | $30,800 | -- | |
| Mitchell Patricia | $98,000 | -- |
Source: Public Records
Mortgage History
| Date | Status | Borrower | Loan Amount |
|---|---|---|---|
| Open | Knowles Natalie | $134,000 | |
| Previous Owner | Wilson Natalie | $89,133 | |
| Previous Owner | Wilson Natalie | $7,500 | |
| Closed | Mitchell Patricia | $0 |
Source: Public Records
Tax History Compared to Growth
Tax History
| Year | Tax Paid | Tax Assessment Tax Assessment Total Assessment is a certain percentage of the fair market value that is determined by local assessors to be the total taxable value of land and additions on the property. | Land | Improvement |
|---|---|---|---|---|
| 2025 | $5,049 | $104,200 | $28,000 | $76,200 |
| 2024 | $5,122 | $105,920 | $28,000 | $77,920 |
| 2023 | $5,122 | $103,200 | $28,000 | $75,200 |
| 2022 | $1,917 | $70,600 | $14,000 | $56,600 |
| 2021 | $1,572 | $55,680 | $17,520 | $38,160 |
| 2020 | $1,470 | $51,080 | $3,760 | $47,320 |
| 2019 | $1,344 | $45,880 | $3,760 | $42,120 |
| 2018 | $1,069 | $37,960 | $3,760 | $34,200 |
| 2017 | $1,248 | $40,680 | $3,760 | $36,920 |
| 2016 | $1,024 | $31,840 | $3,760 | $28,080 |
| 2014 | $1,580 | $26,400 | $3,760 | $22,640 |
Source: Public Records
Map
Nearby Homes
- 440 Ohern Ct
- 467 Oroarke Dr
- 5347 Ocarol Ct
- 366 O Brian Dr
- 432 Rock Meadow Dr
- 629 Waterview Ct Unit 2
- 447 Martindale Ct
- 5350 Rockbridge Rd
- 2234 Rockbridge Rd SW
- 5315 Rockborough Trail
- 610 Martin Rd
- 395 Colchester Dr
- 500 Carillon Ct
- 639 Royal Abbey Dr
- 5476 Old Rockbridge Rd
- 5389 Martins Crossing Rd
- 5377 Martins Crossing Rd
- 400 Palmer Dr
- 5077 Martindale Ln
- 5372 Martins Crossing Rd
- 5440 Oquinn Ct
- 5450 Oquinn Ct
- 438 Ovara Ct
- 5291 Oshea Ln Unit 3
- 448 Ovara Ct
- 5441 Oquinn Ct
- 5299 Oshea Ln
- 5431 Oquinn Ct Unit 3
- 5312 Oconnel Ct
- 5447 Oquinn Ct
- 5281 Oshea Ln Unit n/a
- 5281 Oshea Ln
- 5281 Oshea Ln Unit 3
- 5307 Oshea Ln
- 5307 Oconnel Ct
- 447 Ovara Ct Unit 3
- 5320 Oconnel Ct
- 5296 Oshea Ln
- 5315 Oshea Ln
- 5308 Omalley Ln