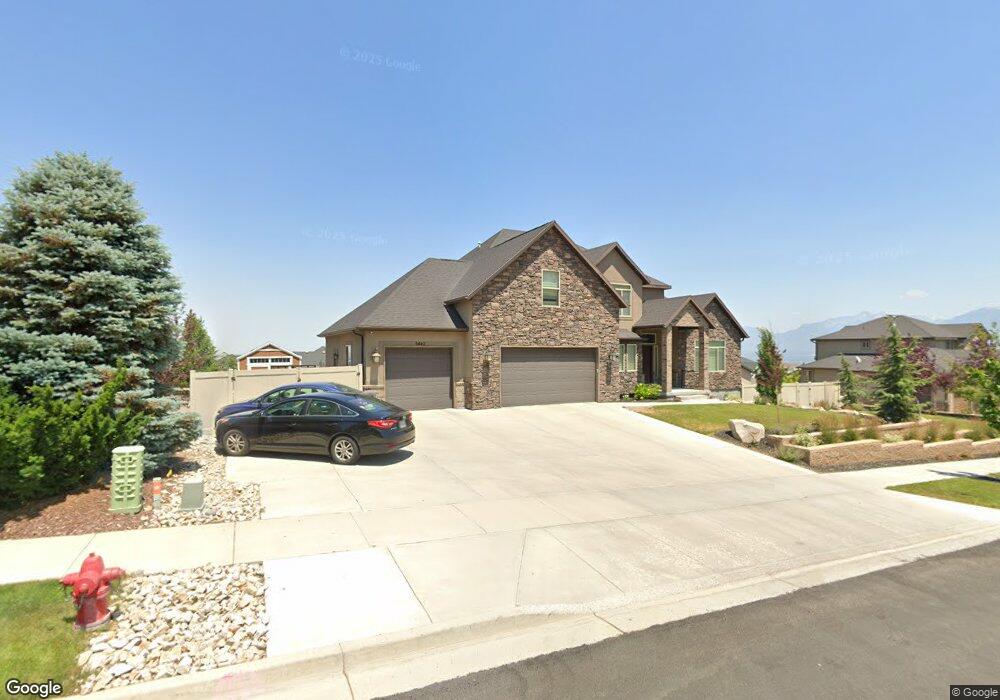
5442 W Pulley Ln Herriman, UT 84096
Estimated Value: $964,000 - $1,170,000
6
Beds
4
Baths
5,403
Sq Ft
$195/Sq Ft
Est. Value
About This Home
This home is located at 5442 W Pulley Ln, Herriman, UT 84096 and is currently estimated at $1,051,489, approximately $194 per square foot. 5442 W Pulley Ln is a home located in Salt Lake County with nearby schools including Blackridge School, Fort Herriman Middle School, and Mountain Ridge High School.
Ownership History
Date
Name
Owned For
Owner Type
Purchase Details
Closed on
Jun 19, 2013
Sold by
Pepperdign Homes
Bought by
Welch Kirk W and Welch Heather R
Current Estimated Value
Home Financials for this Owner
Home Financials are based on the most recent Mortgage that was taken out on this home.
Original Mortgage
$560,642
Outstanding Balance
$403,392
Interest Rate
3.75%
Mortgage Type
FHA
Estimated Equity
$648,097
Purchase Details
Closed on
Sep 21, 2012
Sold by
Todcor Holdings Llc
Bought by
Pepperdign Homes
Home Financials for this Owner
Home Financials are based on the most recent Mortgage that was taken out on this home.
Original Mortgage
$454,680
Interest Rate
3.63%
Mortgage Type
Construction
Purchase Details
Closed on
Apr 29, 2010
Sold by
Lookout Ridge Llc
Bought by
Todcor Holdings Llc
Create a Home Valuation Report for This Property
The Home Valuation Report is an in-depth analysis detailing your home's value as well as a comparison with similar homes in the area
Home Values in the Area
Average Home Value in this Area
Purchase History
| Date | Buyer | Sale Price | Title Company |
|---|---|---|---|
| Welch Kirk W | -- | Gateway Title Ins Agcy Llc | |
| Pepperdign Homes | -- | Big Sky Title Ins Agcy | |
| Todcor Holdings Llc | -- | Paramount Title |
Source: Public Records
Mortgage History
| Date | Status | Borrower | Loan Amount |
|---|---|---|---|
| Open | Welch Kirk W | $560,642 | |
| Previous Owner | Pepperdign Homes | $454,680 |
Source: Public Records
Tax History Compared to Growth
Tax History
| Year | Tax Paid | Tax Assessment Tax Assessment Total Assessment is a certain percentage of the fair market value that is determined by local assessors to be the total taxable value of land and additions on the property. | Land | Improvement |
|---|---|---|---|---|
| 2025 | $5,691 | $970,500 | $287,300 | $683,200 |
| 2024 | $5,691 | $933,400 | $276,900 | $656,500 |
| 2023 | $5,691 | $893,600 | $266,300 | $627,300 |
| 2022 | $5,581 | $863,600 | $261,000 | $602,600 |
| 2021 | $4,745 | $644,600 | $208,800 | $435,800 |
| 2020 | $4,482 | $573,900 | $208,800 | $365,100 |
| 2019 | $4,407 | $554,800 | $208,800 | $346,000 |
| 2018 | $4,320 | $535,500 | $143,900 | $391,600 |
| 2017 | $4,219 | $505,200 | $141,300 | $363,900 |
| 2016 | $4,276 | $502,900 | $165,900 | $337,000 |
| 2015 | $4,209 | $472,300 | $153,700 | $318,600 |
| 2014 | $4,255 | $474,900 | $178,700 | $296,200 |
Source: Public Records
Map
Nearby Homes
- 5532 W Lookout Mesa Cir
- 5527 W Lookout Mesa Cir Unit 120
- 5571 Lookout Mesa Cir
- 15146 S Secret Canyon Cir
- 5314 W Rolling Brook Dr
- 14879 S Headrose Dr
- 5144 Emmeline Dr
- 14642 S Edgemere Dr
- 5386 Emmeline Dr
- 14762 S Desert Sage Dr
- 5194 W Hedgerose Dr
- 5098 W Fortrose Dr
- 5729 Sol Vista Cir
- 5102 W Valmont Way
- 14478 Sun Bloom Ln
- 14881 S Mossley Bend Dr
- 5063 W Arete Way
- 5232 W Courtly Ln
- 4893 W Ridge Rock Cir
- 14903 S Mossley Bend Dr
- 5442 W Pulley Ln Unit 102
- 5443 W Aurora Vista Dr Unit 27
- 5443 W Aurora Vista Dr
- 5462 W Pulley Ln
- 5424 W Pulley Ln
- 5424 W Pulley Ln
- 5462 W Pulley Ln
- 5427 W Aurora Vista Dr
- 15043 S Hunt Harder Dr Unit 143
- 5459 W Aurora Vista Dr
- 5459 W Aurora Vista Dr Unit 26
- 5409 W Aurora Vista Dr Unit 29
- 15048 S Hunt Harder Dr
- 5482 W Pulley Ln
- 5428 W Aurora Vista Dr
- 5428 W Aurora Vista Dr Unit 2
- 5446 W Aurora Vista Dr Unit 3
- 5446 W Aurora Vista Dr Unit 3
- 5477 W Aurora Vista Dr
- 15059 S Hunt Harder Dr