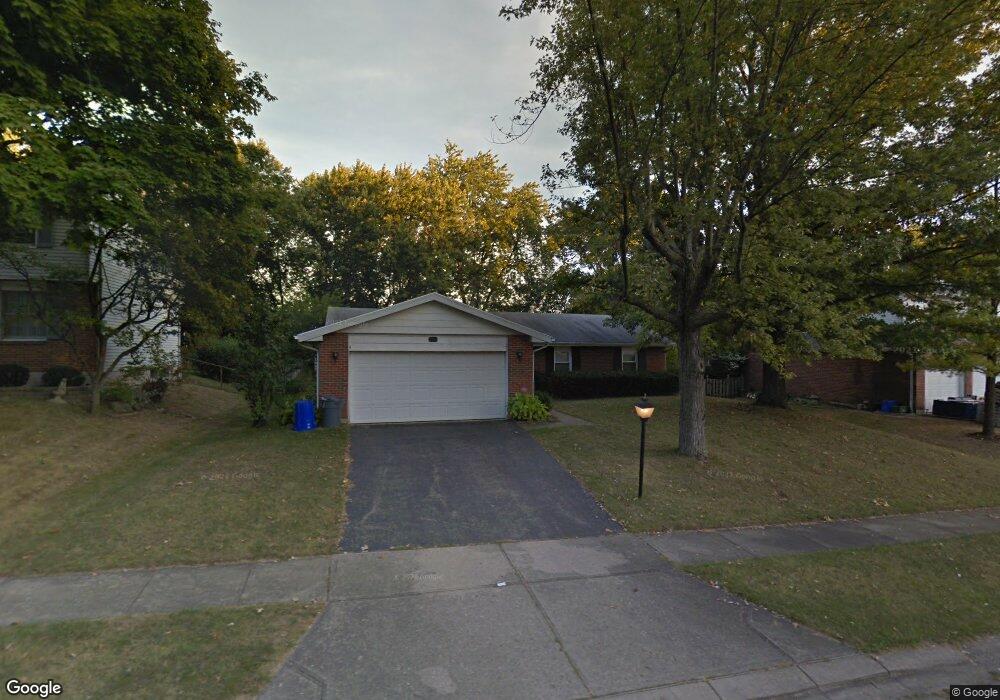
5444 Honeyleaf Way Dayton, OH 45424
Forest Ridge Quail Hollow NeighborhoodEstimated Value: $244,571 - $261,000
3
Beds
2
Baths
1,604
Sq Ft
$157/Sq Ft
Est. Value
About This Home
This home is located at 5444 Honeyleaf Way, Dayton, OH 45424 and is currently estimated at $251,143, approximately $156 per square foot. 5444 Honeyleaf Way is a home located in Montgomery County with nearby schools including Fairborn Primary School, Fairborn Intermediate School, and Fairborn Middle School.
Ownership History
Date
Name
Owned For
Owner Type
Purchase Details
Closed on
Jul 7, 2006
Sold by
Lingerfelt Garland C and Lingerfelt Mary E
Bought by
Underwood Roman T and Underwood Cheryl Patch
Current Estimated Value
Home Financials for this Owner
Home Financials are based on the most recent Mortgage that was taken out on this home.
Original Mortgage
$136,881
Outstanding Balance
$81,621
Interest Rate
6.73%
Mortgage Type
VA
Estimated Equity
$169,522
Purchase Details
Closed on
May 28, 2004
Sold by
Quinn Dolores M and Hutchinson Twila D
Bought by
Lingerfelt Garland C and Lingerfelt Mary E
Home Financials for this Owner
Home Financials are based on the most recent Mortgage that was taken out on this home.
Original Mortgage
$118,750
Interest Rate
6.06%
Mortgage Type
Purchase Money Mortgage
Purchase Details
Closed on
Sep 2, 1997
Sold by
Thomas Martha M
Bought by
Quinn Dolores M and Quinn Delores M
Create a Home Valuation Report for This Property
The Home Valuation Report is an in-depth analysis detailing your home's value as well as a comparison with similar homes in the area
Home Values in the Area
Average Home Value in this Area
Purchase History
| Date | Buyer | Sale Price | Title Company |
|---|---|---|---|
| Underwood Roman T | $134,000 | None Available | |
| Lingerfelt Garland C | $125,000 | -- | |
| Quinn Dolores M | $55,900 | -- |
Source: Public Records
Mortgage History
| Date | Status | Borrower | Loan Amount |
|---|---|---|---|
| Open | Underwood Roman T | $136,881 | |
| Previous Owner | Lingerfelt Garland C | $118,750 |
Source: Public Records
Tax History Compared to Growth
Tax History
| Year | Tax Paid | Tax Assessment Tax Assessment Total Assessment is a certain percentage of the fair market value that is determined by local assessors to be the total taxable value of land and additions on the property. | Land | Improvement |
|---|---|---|---|---|
| 2024 | $3,653 | $61,590 | $13,720 | $47,870 |
| 2023 | $3,653 | $61,590 | $13,720 | $47,870 |
| 2022 | $2,813 | $43,990 | $9,800 | $34,190 |
| 2021 | $2,836 | $43,990 | $9,800 | $34,190 |
| 2020 | $2,847 | $43,990 | $9,800 | $34,190 |
| 2019 | $2,440 | $37,080 | $9,800 | $27,280 |
| 2018 | $2,467 | $37,080 | $9,800 | $27,280 |
| 2017 | $2,418 | $37,080 | $9,800 | $27,280 |
| 2016 | $2,379 | $36,520 | $9,800 | $26,720 |
| 2015 | $2,395 | $36,520 | $9,800 | $26,720 |
| 2014 | $2,395 | $36,520 | $9,800 | $26,720 |
| 2012 | -- | $43,280 | $10,500 | $32,780 |
Source: Public Records
Map
Nearby Homes
- 0 Forest Ridge Blvd Unit 937866
- 4048 Quail Bush Dr
- 4288 Dobbin Cir
- 4294 Dobbin Cir
- 4222 Meadowsweet Dr
- 3812 Ninebark Place
- 5411 Zachary Ln
- 5415 Zachary Ln
- 5423 Zachary Ln
- 5419 Zachary Ln
- 5408 Zachary Ln
- 2757 Amberwood Dr Unit 17-300
- 5418 Zachary Ln
- 4403 Woodpoint Ct
- 5540 Signet Dr
- 4416 Hawk Watch Way
- 4799 Blue Spruce Ct
- 5027 Katherine Ct
- 3531 Forest Ridge Blvd
- 4426 Rainbrook Way
- 5454 Honeyleaf Way
- 5434 Honeyleaf Way
- 3926 Cozycroft Dr
- 3920 Cozycroft Dr
- 5464 Honeyleaf Way
- 5426 Honeyleaf Way
- 3932 Cozycroft Dr
- 5443 Honeyleaf Way
- 5455 Honeyleaf Way
- 3914 Cozycroft Dr
- 5433 Honeyleaf Way
- 3938 Cozycroft Dr
- 5474 Honeyleaf Way
- 5418 Honeyleaf Way
- 5465 Honeyleaf Way
- 3908 Cozycroft Dr
- 3944 Cozycroft Dr
- 5475 Honeyleaf Way
- 5417 Honeyleaf Way
- 5410 Honeyleaf Way