5445 Oakland St Philadelphia, PA 19124
Frankford NeighborhoodEstimated Value: $219,000 - $238,000
3
Beds
1
Bath
1,416
Sq Ft
$160/Sq Ft
Est. Value
About This Home
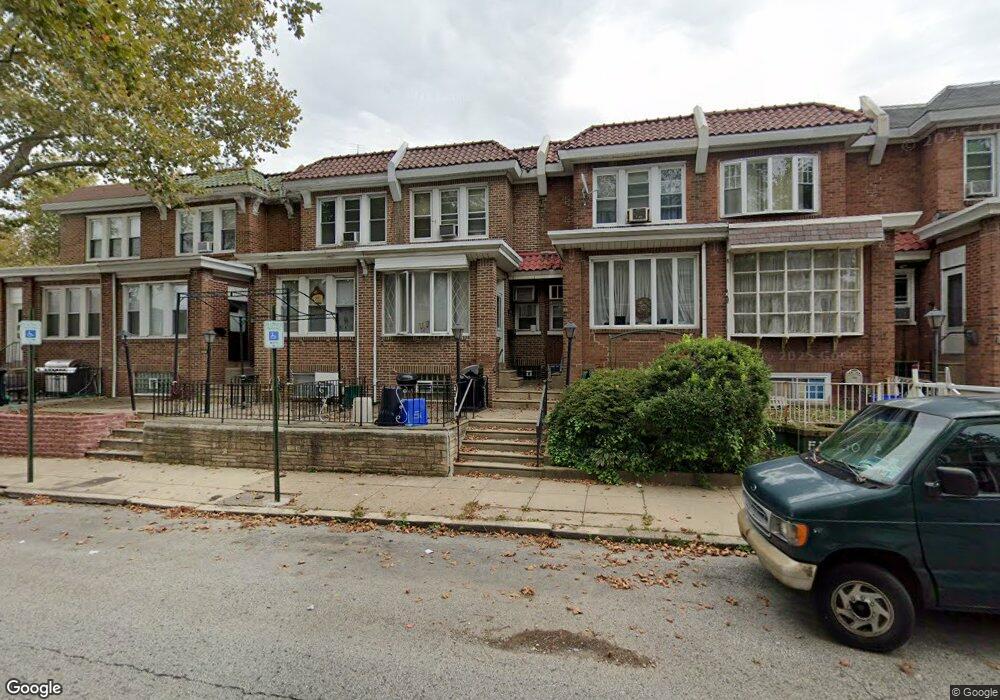
This home is located at 5445 Oakland St, Philadelphia, PA 19124 and is currently estimated at $226,792, approximately $160 per square foot. 5445 Oakland St is a home located in Philadelphia County with nearby schools including Frankford High School, The Philadelphia Charter School for the Arts & Sciences, and Mastery Schools Smedley Elementary.
Ownership History
Date
Name
Owned For
Owner Type
Purchase Details
Closed on
Oct 26, 2001
Sold by
Geinnotta Anthony C
Bought by
Campbell Annie M
Current Estimated Value
Home Financials for this Owner
Home Financials are based on the most recent Mortgage that was taken out on this home.
Original Mortgage
$56,905
Outstanding Balance
$21,834
Interest Rate
6.77%
Estimated Equity
$204,958
Create a Home Valuation Report for This Property
The Home Valuation Report is an in-depth analysis detailing your home's value as well as a comparison with similar homes in the area
Home Values in the Area
Average Home Value in this Area
Purchase History
| Date | Buyer | Sale Price | Title Company |
|---|---|---|---|
| Campbell Annie M | $59,900 | T A Title Insurance Company |
Source: Public Records
Mortgage History
| Date | Status | Borrower | Loan Amount |
|---|---|---|---|
| Open | Campbell Annie M | $56,905 | |
| Closed | Campbell Annie M | $5,000 |
Source: Public Records
Tax History Compared to Growth
Tax History
| Year | Tax Paid | Tax Assessment Tax Assessment Total Assessment is a certain percentage of the fair market value that is determined by local assessors to be the total taxable value of land and additions on the property. | Land | Improvement |
|---|---|---|---|---|
| 2026 | $2,079 | $180,200 | $36,040 | $144,160 |
| 2025 | $2,079 | $180,200 | $36,040 | $144,160 |
| 2024 | $2,079 | $180,200 | $36,040 | $144,160 |
| 2023 | $2,079 | $148,500 | $29,700 | $118,800 |
| 2022 | $942 | $103,500 | $29,700 | $73,800 |
| 2021 | $1,572 | $0 | $0 | $0 |
| 2020 | $1,572 | $0 | $0 | $0 |
| 2019 | $1,509 | $0 | $0 | $0 |
| 2018 | $956 | $0 | $0 | $0 |
| 2017 | $1,376 | $0 | $0 | $0 |
| 2016 | $956 | $0 | $0 | $0 |
| 2015 | $915 | $0 | $0 | $0 |
| 2014 | -- | $98,300 | $15,070 | $83,230 |
| 2012 | -- | $13,312 | $1,251 | $12,061 |
Source: Public Records
Map
Nearby Homes