Estimated Value: $427,376 - $465,000
3
Beds
2
Baths
1,806
Sq Ft
$245/Sq Ft
Est. Value
About This Home
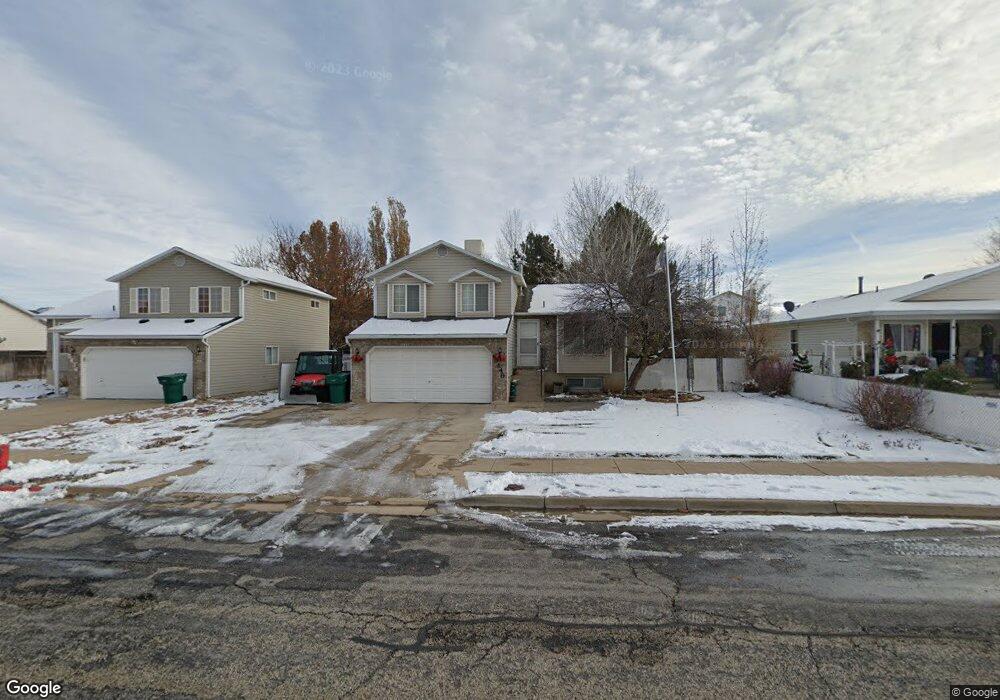
This home is located at 5446 S 3400 W, Roy, UT 84067 and is currently estimated at $441,594, approximately $244 per square foot. 5446 S 3400 W is a home located in Weber County with nearby schools including Roy Elementary School, Roy Junior High School, and Roy High School.
Ownership History
Date
Name
Owned For
Owner Type
Purchase Details
Closed on
Aug 29, 2005
Sold by
Eddy Thomas B and Eddy Laura D
Bought by
Lloyd Christopher
Current Estimated Value
Purchase Details
Closed on
Aug 23, 2001
Sold by
Vogel Myriam C
Bought by
Eddy Thomas B and Eddy Laura D
Create a Home Valuation Report for This Property
The Home Valuation Report is an in-depth analysis detailing your home's value as well as a comparison with similar homes in the area
Home Values in the Area
Average Home Value in this Area
Purchase History
| Date | Buyer | Sale Price | Title Company |
|---|---|---|---|
| Lloyd Christopher | -- | Backman | |
| Eddy Thomas B | -- | Founders Title Co |
Source: Public Records
Tax History Compared to Growth
Tax History
| Year | Tax Paid | Tax Assessment Tax Assessment Total Assessment is a certain percentage of the fair market value that is determined by local assessors to be the total taxable value of land and additions on the property. | Land | Improvement |
|---|---|---|---|---|
| 2025 | $265 | $407,891 | $125,355 | $282,536 |
| 2024 | $776 | $220,549 | $68,945 | $151,604 |
| 2023 | $1,991 | $218,350 | $69,481 | $148,869 |
| 2022 | $2,172 | $222,200 | $61,763 | $160,437 |
| 2021 | $1,810 | $315,000 | $82,869 | $232,131 |
| 2020 | $1,614 | $265,000 | $82,869 | $182,131 |
| 2019 | $1,579 | $247,000 | $48,245 | $198,755 |
| 2018 | $1,549 | $231,000 | $44,461 | $186,539 |
| 2017 | $1,745 | $198,000 | $44,461 | $153,539 |
| 2016 | $1,615 | $98,012 | $24,718 | $73,294 |
| 2015 | $1,441 | $88,839 | $21,945 | $66,894 |
| 2014 | $1,382 | $83,834 | $21,945 | $61,889 |
Source: Public Records
Map
Nearby Homes
- 5578 S 3450 W
- 5432 S 3150 W
- 5538 S 3150 W
- 3186 W 5625 S
- 5321 S 3100 W
- 3176 W 5625 S
- 3607 W 5400 S
- 3166 W 5625 S
- 3443 W 5200 S Unit 2&3
- 5791 S 3260 W
- 3198 W 5825 S
- 5859 S 3500 W
- 3766 W 5300 S
- 4964 S 3375 W
- 3809 W 5625 S
- 3826 W 5750 S
- 3780 W 5850 S
- 2907 W 5775 S
- 3509 W 4835 S Unit 26
- 2786 W 5550 S Unit C11