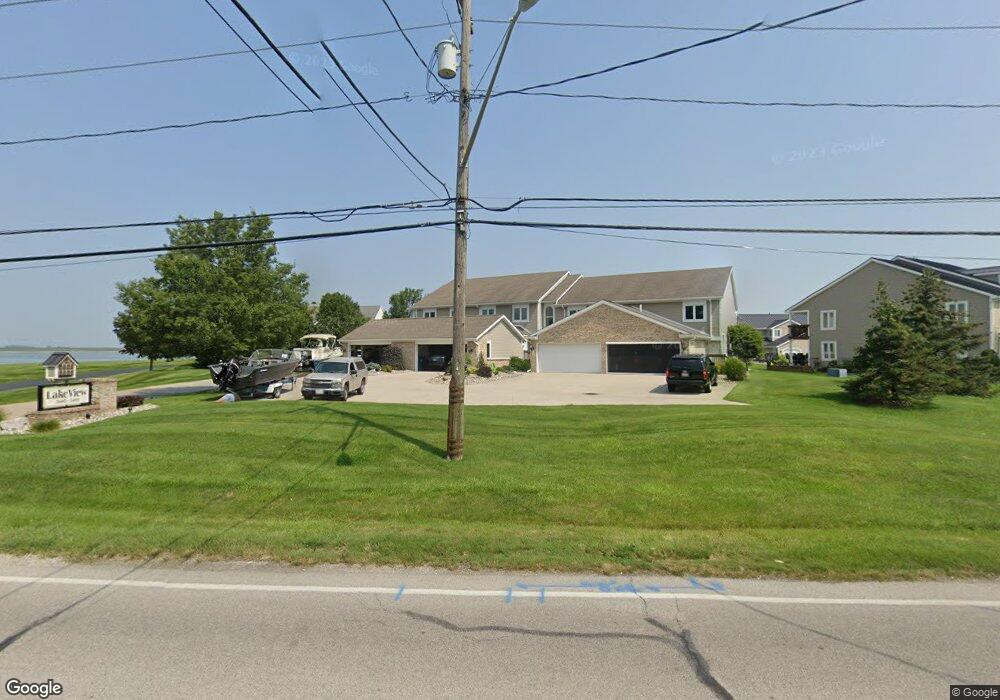
5447 Bayshore Rd Oregon, OH 43616
Estimated Value: $275,000 - $398,784
2
Beds
3
Baths
1,508
Sq Ft
$231/Sq Ft
Est. Value
About This Home
This home is located at 5447 Bayshore Rd, Oregon, OH 43616 and is currently estimated at $348,196, approximately $230 per square foot. 5447 Bayshore Rd is a home located in Lucas County.
Ownership History
Date
Name
Owned For
Owner Type
Purchase Details
Closed on
May 3, 2024
Sold by
Newell-Turner Carolyn
Bought by
Richard A Jaquette Trust and Jaquette
Current Estimated Value
Purchase Details
Closed on
Aug 24, 2022
Sold by
Perlaky Adam J
Bought by
Richard A Jaquette Trust and Jaquette
Purchase Details
Closed on
Apr 22, 2022
Sold by
Perlaky Adam
Bought by
Joseph A Perlaky
Purchase Details
Closed on
Dec 16, 2021
Sold by
Perlaky Joseph and Perlaky Joseph A
Bought by
Perlaky Adam
Purchase Details
Closed on
Jun 5, 2020
Sold by
Lonsway Gerard E and Lonsway Nancy L
Bought by
Perlaky Joseph A
Purchase Details
Closed on
Sep 24, 1996
Sold by
Benton Robert H
Bought by
Lonsway Gerald E and Lonsway Nancy L
Home Financials for this Owner
Home Financials are based on the most recent Mortgage that was taken out on this home.
Original Mortgage
$30,000
Interest Rate
7.93%
Mortgage Type
New Conventional
Create a Home Valuation Report for This Property
The Home Valuation Report is an in-depth analysis detailing your home's value as well as a comparison with similar homes in the area
Home Values in the Area
Average Home Value in this Area
Purchase History
| Date | Buyer | Sale Price | Title Company |
|---|---|---|---|
| Richard A Jaquette Trust | -- | None Listed On Document | |
| Richard A Jaquette Trust | $375,000 | None Listed On Document | |
| Joseph A Perlaky | -- | -- | |
| Perlaky Adam | -- | None Available | |
| Perlaky Joseph A | $230,000 | Chicago Title | |
| Lonsway Gerald E | $192,000 | -- |
Source: Public Records
Mortgage History
| Date | Status | Borrower | Loan Amount |
|---|---|---|---|
| Previous Owner | Lonsway Gerald E | $30,000 |
Source: Public Records
Tax History Compared to Growth
Tax History
| Year | Tax Paid | Tax Assessment Tax Assessment Total Assessment is a certain percentage of the fair market value that is determined by local assessors to be the total taxable value of land and additions on the property. | Land | Improvement |
|---|---|---|---|---|
| 2024 | $2,928 | $124,005 | $14,315 | $109,690 |
| 2023 | $4,305 | $77,525 | $11,550 | $65,975 |
| 2022 | $3,855 | $77,525 | $11,550 | $65,975 |
| 2021 | $3,886 | $77,525 | $11,550 | $65,975 |
| 2020 | $4,188 | $74,690 | $9,695 | $64,995 |
| 2019 | $4,069 | $74,690 | $9,695 | $64,995 |
| 2018 | $4,097 | $74,690 | $9,695 | $64,995 |
| 2017 | $4,226 | $73,010 | $9,485 | $63,525 |
| 2016 | $4,171 | $208,600 | $27,100 | $181,500 |
| 2015 | $4,240 | $208,600 | $27,100 | $181,500 |
| 2014 | $3,705 | $69,550 | $9,030 | $60,520 |
| 2013 | $3,705 | $69,550 | $9,030 | $60,520 |
Source: Public Records
Map
Nearby Homes
- 5243 Eagles Landing Dr
- 5911 Plympton Cir
- 1633 Grand Bay Dr
- 2057 Blanche Dr
- 2001 Lilias Dr
- 5305 Cedar Point Rd
- 2079 Arkansas St
- 140 N Wynn Rd
- 4263 Corduroy Rd
- 6530 Corduroy Rd
- 234 Avilyn Ln
- 5054 Magnolia Dr
- 5065 Magnolia Dr
- 5047 Noah Ln
- 3706 Corduroy Rd
- 5037 Easton Dr
- 5033 Easton Dr
- 5029 Easton Dr
- 5025 Easton Dr
- 5021 Easton Dr
- 5449 Bay Shore Rd
- 5463 Bayshore Rd Unit 5463
- 5463 Bay Shore Rd
- 5463 Bay Shore Rd Unit 5463
- 5465 Bayshore Rd Unit 5465
- 5467 Bayshore Rd Unit 5467
- 5451 Bayshore Rd Unit 5451
- 5449 Bayshore Rd Unit 5449
- 5453 Bayshore Rd Unit 5453
- 5469 Bayshore Rd Unit 5469
- 5435 Bayshore Rd
- 5473 Bayshore Rd Unit 5473
- 5489 Bayshore Rd
- 5491 Bayshore Rd Unit 5491
- 5501 Bayshore Rd
- 5829 Bay Shore Rd
- 5127 Bay Shore Rd
- 5497 Bayshore Rd
- 5442 Bayshore Rd Unit 5442
- 5432 Bayshore Rd Unit 5432