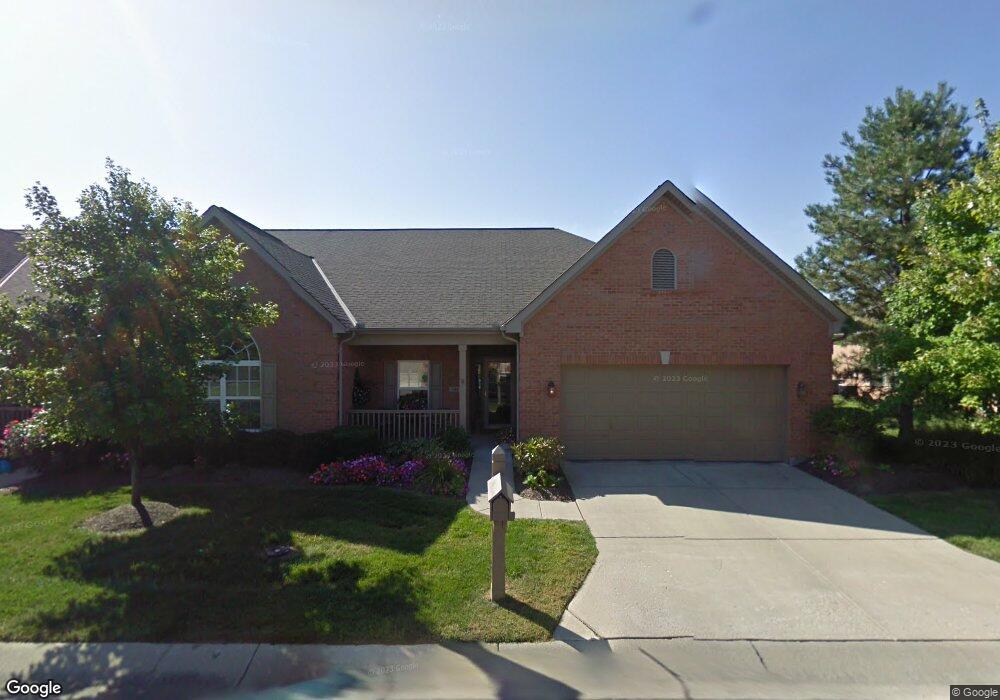
5447 Harbourside Dr Mason, OH 45040
Deerfield Township NeighborhoodEstimated Value: $300,000 - $341,000
3
Beds
2
Baths
1,674
Sq Ft
$189/Sq Ft
Est. Value
About This Home
This home is located at 5447 Harbourside Dr, Mason, OH 45040 and is currently estimated at $316,036, approximately $188 per square foot. 5447 Harbourside Dr is a home located in Warren County with nearby schools including Mason Intermediate Elementary School, Mason Middle School, and William Mason High School.
Ownership History
Date
Name
Owned For
Owner Type
Purchase Details
Closed on
May 18, 2016
Sold by
Singson Federico M and Singson Peggy
Bought by
Zhao Junfang
Current Estimated Value
Home Financials for this Owner
Home Financials are based on the most recent Mortgage that was taken out on this home.
Original Mortgage
$115,000
Outstanding Balance
$50,829
Interest Rate
3.59%
Mortgage Type
New Conventional
Estimated Equity
$265,207
Purchase Details
Closed on
Jul 7, 2005
Sold by
Meisner Patricia A
Bought by
Singson Frederico M
Purchase Details
Closed on
Sep 28, 2000
Sold by
Harbour Watch Llc
Bought by
Singson Federico M and Meisner Patricia A
Home Financials for this Owner
Home Financials are based on the most recent Mortgage that was taken out on this home.
Original Mortgage
$100,000
Interest Rate
7.98%
Mortgage Type
New Conventional
Create a Home Valuation Report for This Property
The Home Valuation Report is an in-depth analysis detailing your home's value as well as a comparison with similar homes in the area
Home Values in the Area
Average Home Value in this Area
Purchase History
| Date | Buyer | Sale Price | Title Company |
|---|---|---|---|
| Zhao Junfang | -- | Attorney | |
| Singson Frederico M | -- | -- | |
| Singson Federico M | $174,900 | -- |
Source: Public Records
Mortgage History
| Date | Status | Borrower | Loan Amount |
|---|---|---|---|
| Open | Zhao Junfang | $115,000 | |
| Previous Owner | Singson Federico M | $100,000 |
Source: Public Records
Tax History Compared to Growth
Tax History
| Year | Tax Paid | Tax Assessment Tax Assessment Total Assessment is a certain percentage of the fair market value that is determined by local assessors to be the total taxable value of land and additions on the property. | Land | Improvement |
|---|---|---|---|---|
| 2024 | $3,864 | $90,840 | $21,000 | $69,840 |
| 2023 | $3,584 | $70,682 | $8,610 | $62,072 |
| 2022 | $3,584 | $70,683 | $8,610 | $62,073 |
| 2021 | $3,408 | $70,683 | $8,610 | $62,073 |
| 2020 | $3,263 | $57,467 | $7,000 | $50,467 |
| 2019 | $3,023 | $57,467 | $7,000 | $50,467 |
| 2018 | $3,035 | $57,467 | $7,000 | $50,467 |
| 2017 | $2,924 | $51,086 | $6,332 | $44,755 |
| 2016 | $2,491 | $51,086 | $6,332 | $44,755 |
| 2015 | $2,497 | $51,086 | $6,332 | $44,755 |
| 2014 | $2,491 | $47,740 | $5,920 | $41,830 |
| 2013 | $2,496 | $56,470 | $7,000 | $49,470 |
Source: Public Records
Map
Nearby Homes
- 5626 Baywatch Way
- 5661 Baywatch Way
- 5339 Mapledale Way
- 8421 Cameron Ct
- 7648 Waterfront Way
- 7660 Waterfront Way
- 7692 Waterfront Way
- 7693 Misty Springs Ct
- 7600 Waterfront Way
- 5369 N Shore Place
- 7725 Livingston Dr
- 7511 Somerset Rd
- 7858 Yellowwood Dr
- 8659 Coveview Ct
- 4765 Mallard Creek Dr
- 5532 Winding Cape Way
- 6266 Trailwood Ct
- 5641 Melbury Ct
- 7531 Kousa Ct
- 7911 Meadowbrook Dr
- 5447 Harbourside Dr
- 5443 Harbourside Dr
- 5443 Harbourside Dr
- 5443 Harbourside Dr Unit 103
- 5439 Harbourside Dr
- 5439 Harbourside Dr
- 5463 Harbourside Dr
- 5463 Harbourside Dr
- 5448 Harbourside Dr Unit G150
- 5448 Harbourside Dr Unit 104
- 5448 Harbourside Dr
- 5433 Harbourside Dr
- 5433 Harbourside Dr
- 5548 Harbourwatch Way Unit 203
- 5548 Harbourwatch Way
- 5548 Harbourwatch Way Unit 103
- 5548 Harbourwatch Way Unit 204
- 5548 Harbourwatch Way Unit 203
- 5548 Harbourwatch Way Unit G143
- 5548 Harbourwatch Way Unit 204