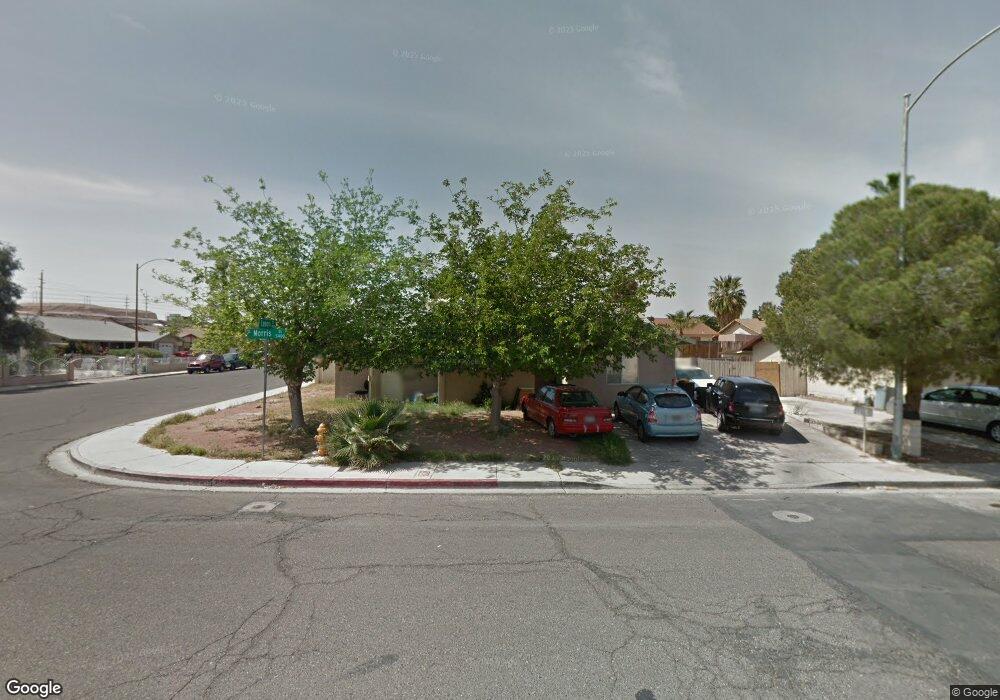
5447 Morris St Las Vegas, NV 89122
Estimated Value: $383,932 - $422,000
4
Beds
2
Baths
1,822
Sq Ft
$219/Sq Ft
Est. Value
About This Home
This home is located at 5447 Morris St, Las Vegas, NV 89122 and is currently estimated at $399,483, approximately $219 per square foot. 5447 Morris St is a home located in Clark County with nearby schools including Harley Harmon Elementary School, Francis H Cortney Junior High School, and Del Sol Academy of the Performing Arts.
Ownership History
Date
Name
Owned For
Owner Type
Purchase Details
Closed on
Jul 19, 2012
Sold by
Khoudoian Naira
Bought by
Pinho Mathew Kl
Current Estimated Value
Home Financials for this Owner
Home Financials are based on the most recent Mortgage that was taken out on this home.
Original Mortgage
$112,917
Outstanding Balance
$76,829
Interest Rate
3.37%
Mortgage Type
FHA
Estimated Equity
$322,654
Purchase Details
Closed on
Feb 6, 2012
Sold by
Khoudoian Biarch
Bought by
Khoudoian Naira
Purchase Details
Closed on
Sep 8, 2011
Sold by
Harter Gloria J
Bought by
Bank Of America N A
Purchase Details
Closed on
Aug 16, 1996
Sold by
Chandler Cynthia R
Bought by
Elle Gloria Harter and Elle Lemuel L
Home Financials for this Owner
Home Financials are based on the most recent Mortgage that was taken out on this home.
Original Mortgage
$103,988
Interest Rate
8.18%
Mortgage Type
FHA
Create a Home Valuation Report for This Property
The Home Valuation Report is an in-depth analysis detailing your home's value as well as a comparison with similar homes in the area
Home Values in the Area
Average Home Value in this Area
Purchase History
| Date | Buyer | Sale Price | Title Company |
|---|---|---|---|
| Pinho Mathew Kl | $115,000 | Fidelity National Title Las | |
| Khoudoin Naira | -- | Fidelity National Title Las | |
| Khoudoian Naira | -- | Chicago Title Las Vegas | |
| Khoudoian Naira | $46,700 | Chicago Title Las Vegas | |
| Bank Of America N A | $63,900 | Pasion Title Services | |
| Elle Gloria Harter | $105,000 | Ati Title |
Source: Public Records
Mortgage History
| Date | Status | Borrower | Loan Amount |
|---|---|---|---|
| Open | Pinho Mathew Kl | $112,917 | |
| Previous Owner | Elle Gloria Harter | $103,988 |
Source: Public Records
Tax History Compared to Growth
Tax History
| Year | Tax Paid | Tax Assessment Tax Assessment Total Assessment is a certain percentage of the fair market value that is determined by local assessors to be the total taxable value of land and additions on the property. | Land | Improvement |
|---|---|---|---|---|
| 2025 | $1,146 | $56,893 | $26,250 | $30,643 |
| 2024 | $1,062 | $56,893 | $26,250 | $30,643 |
| 2023 | $707 | $55,072 | $24,850 | $30,222 |
| 2022 | $983 | $50,471 | $22,400 | $28,071 |
| 2021 | $911 | $48,160 | $21,000 | $27,160 |
| 2020 | $843 | $46,628 | $19,250 | $27,378 |
| 2019 | $790 | $42,396 | $15,050 | $27,346 |
| 2018 | $754 | $40,463 | $14,000 | $26,463 |
| 2017 | $1,185 | $40,402 | $13,300 | $27,102 |
| 2016 | $707 | $35,330 | $7,350 | $27,980 |
| 2015 | $704 | $31,954 | $7,350 | $24,604 |
| 2014 | $682 | $22,570 | $5,250 | $17,320 |
Source: Public Records
Map
Nearby Homes
- 5251 Tipper Ave
- 4999 Nellis Cir
- 5030 E Hacienda Ave
- 5289 Chattanooga Ave
- 5359 Chattanooga Ave
- 5284 Wellesley Ave
- 4915 E Russell Rd
- 5142 Morris St
- 5155 Saratoga Dr
- 5225 Saratoga Dr
- 5068 Killarney St
- 5022 Carmel Ave Unit 3
- 5122 Gregg Place
- 4990 Denning St
- 5750 E Hacienda Ave Unit 203
- 5750 E Hacienda Ave Unit 202
- 5750 E Hacienda Ave Unit 117
- 5751 E Hacienda Ave Unit 159
- 5751 E Hacienda Ave Unit 142
- 5751 E Hacienda Ave Unit 243
- 5437 Morris St
- 5448 Jocelyn Dr Unit 2
- 5438 Jocelyn Dr
- 5427 Morris St
- 5455 Night Glare St
- 5183 Lenora Dr
- 5459 Night Glare St
- 5193 Lenora Dr
- 5428 Jocelyn Dr
- 5463 Night Glare St
- 5173 Lenora Dr
- 5417 Morris St
- 5201 Fire Night Ave
- 5207 Fire Night Ave
- 5418 Jocelyn Dr
- 5163 Lenora Dr
- 5213 Fire Night Ave
- 5456 Night Glare St
- 5219 Fire Night Ave
- 5447 Jocelyn Dr