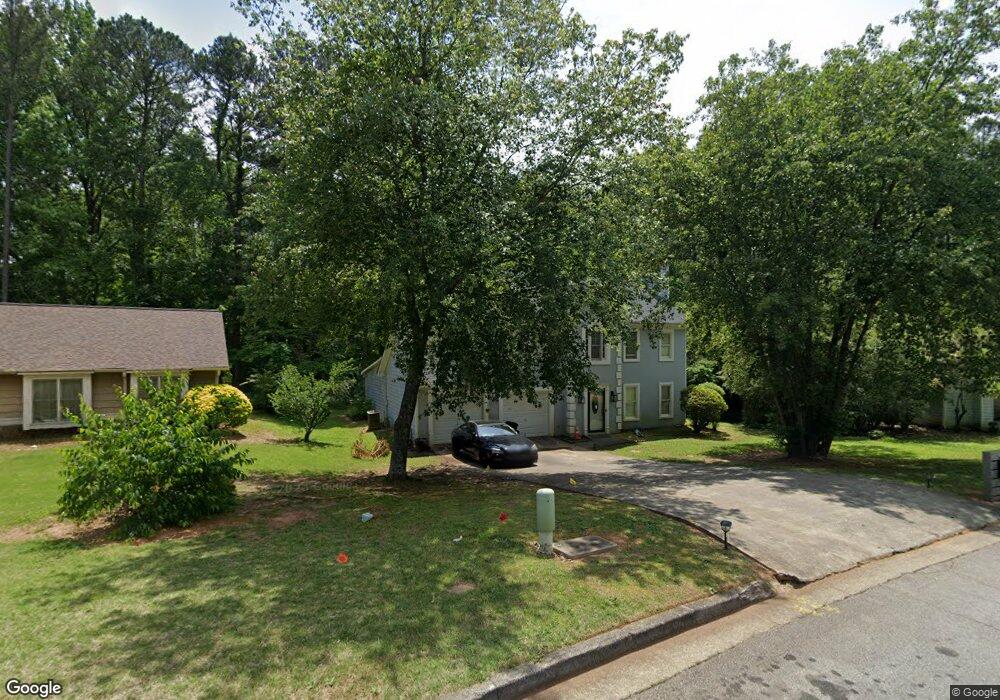
5447 Winslow Crossing N Lithonia, GA 30038
Estimated Value: $231,000 - $243,000
4
Beds
3
Baths
1,690
Sq Ft
$141/Sq Ft
Est. Value
About This Home
This home is located at 5447 Winslow Crossing N, Lithonia, GA 30038 and is currently estimated at $237,790, approximately $140 per square foot. 5447 Winslow Crossing N is a home located in DeKalb County with nearby schools including Flat Rock Elementary School, Salem Middle School, and Martin Luther King- Jr. High School.
Ownership History
Date
Name
Owned For
Owner Type
Purchase Details
Closed on
Aug 19, 2009
Sold by
Aurora Ln Svcs Llc
Bought by
Gosby Starett G
Current Estimated Value
Purchase Details
Closed on
Apr 7, 2009
Sold by
Thomas Mark A
Bought by
Aurora Ln Svcs Llc
Purchase Details
Closed on
Oct 27, 2004
Sold by
Hud
Bought by
Thomas Mark A
Home Financials for this Owner
Home Financials are based on the most recent Mortgage that was taken out on this home.
Original Mortgage
$129,422
Interest Rate
5.64%
Purchase Details
Closed on
Jan 6, 2004
Sold by
Certificateholder Of Reperform
Bought by
Hud
Purchase Details
Closed on
Aug 4, 2000
Sold by
Vilbon Jean C and Mj Barbara
Bought by
Benjamin Antoinette and Benjamin Franklin
Home Financials for this Owner
Home Financials are based on the most recent Mortgage that was taken out on this home.
Original Mortgage
$133,797
Interest Rate
8.11%
Mortgage Type
FHA
Create a Home Valuation Report for This Property
The Home Valuation Report is an in-depth analysis detailing your home's value as well as a comparison with similar homes in the area
Home Values in the Area
Average Home Value in this Area
Purchase History
| Date | Buyer | Sale Price | Title Company |
|---|---|---|---|
| Gosby Starett G | $47,500 | -- | |
| Aurora Ln Svcs Llc | $121,298 | -- | |
| Thomas Mark A | -- | -- | |
| Hud | -- | -- | |
| Wells Fargo Bk Minn | $138,371 | -- | |
| Benjamin Antoinette | $134,900 | -- |
Source: Public Records
Mortgage History
| Date | Status | Borrower | Loan Amount |
|---|---|---|---|
| Previous Owner | Thomas Mark A | $129,422 | |
| Previous Owner | Benjamin Antoinette | $133,797 |
Source: Public Records
Tax History Compared to Growth
Tax History
| Year | Tax Paid | Tax Assessment Tax Assessment Total Assessment is a certain percentage of the fair market value that is determined by local assessors to be the total taxable value of land and additions on the property. | Land | Improvement |
|---|---|---|---|---|
| 2025 | $812 | $105,360 | $16,000 | $89,360 |
| 2024 | $852 | $108,200 | $16,000 | $92,200 |
| 2023 | $852 | $106,280 | $16,000 | $90,280 |
| 2022 | $2,310 | $80,680 | $4,920 | $75,760 |
| 2021 | $1,794 | $57,440 | $4,920 | $52,520 |
| 2020 | $1,629 | $50,880 | $4,920 | $45,960 |
| 2019 | $1,640 | $50,560 | $4,920 | $45,640 |
| 2018 | $1,420 | $50,560 | $4,920 | $45,640 |
| 2017 | $1,491 | $39,760 | $4,920 | $34,840 |
| 2016 | $971 | $29,560 | $4,920 | $24,640 |
| 2014 | $894 | $27,240 | $4,920 | $22,320 |
Source: Public Records
Map
Nearby Homes
- 5437 Winslow Crossing N
- 5364 Winslow Crossing
- 5600 Rock Springs Rd
- 3026 Highland Park Ln Unit II
- 5515 Rock Springs Rd
- 5436 Brisbane Ct Unit 1
- 3027 Fair Creek Ct
- 3248 Brisbane Way
- 3274 Adelade Ct
- 5585 Fairington Place
- 5614 Regency Forest Ct
- 3309 Panola Rd
- 5360 Tasman Trail
- 3340 Fannin Ct
- 5556 Claridge Cir Unit 1
- 3255 Hunters Crossing Point
- 177 Rue Fontaine Unit 2
- 5536 La Fleur Trail
- 38 Le Parc Fontaine
- 54 Le Parc Fontaine
- 5453 Winslow Crossing N
- 5443 Winslow Crossing N
- 5443 Winslow Crossing N
- 5399 Lambray Ct
- 3155 Frost Ln Unit 2
- 5395 Lambray Ct
- 5446 Winslow Crossing N
- 5400 Lambray Ct
- 3151 Frost Ln
- 5438 Winslow Crossing N
- 5458 Winslow Crossing N
- 5429 Winslow Crossing N
- 5465 Winslow Crossing N
- 5391 Lambray Ct
- 5398 Chauvin Place
- 3137 Frost Ln
- 5394 Lambray Ct
- 5430 Winslow Crossing N
- 3156 Frost Ln
- 5470 Winslow Crossing N Unit 1