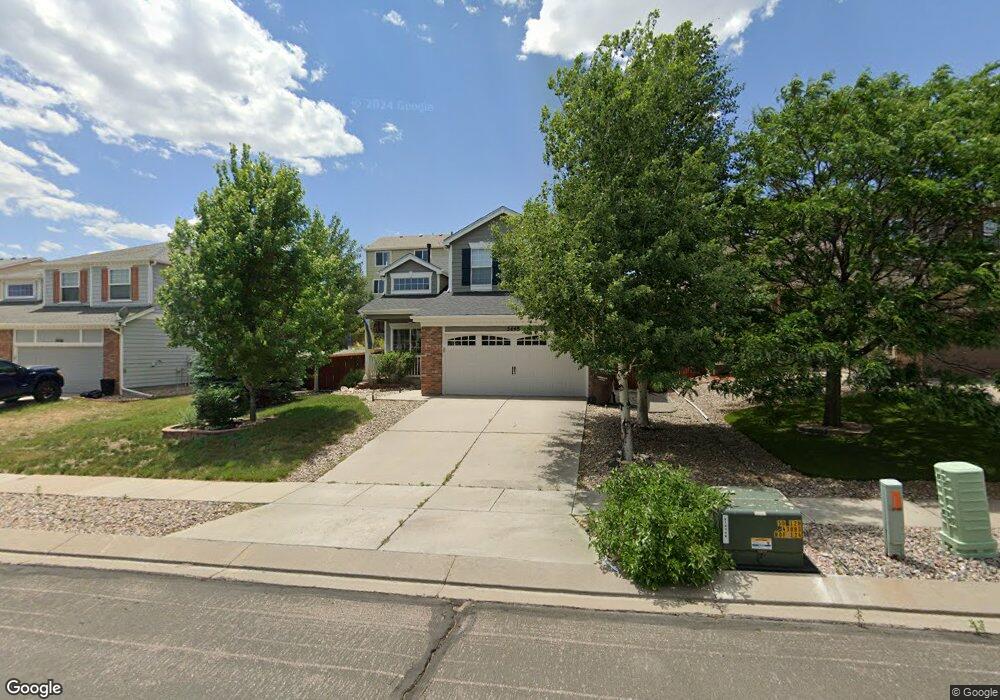
5448 Cindy River Dr Colorado Springs, CO 80917
Old Farms NeighborhoodEstimated Value: $491,000 - $542,000
5
Beds
3
Baths
2,600
Sq Ft
$197/Sq Ft
Est. Value
About This Home
This home is located at 5448 Cindy River Dr, Colorado Springs, CO 80917 and is currently estimated at $511,526, approximately $196 per square foot. 5448 Cindy River Dr is a home located in El Paso County with nearby schools including Scott Elementary School, Jenkins Middle School, and Doherty High School.
Ownership History
Date
Name
Owned For
Owner Type
Purchase Details
Closed on
Aug 27, 2021
Sold by
Dubytskyi Vitalii
Bought by
Dubytskyi Jenna Elaine
Current Estimated Value
Purchase Details
Closed on
Jun 2, 2021
Sold by
Taylor Jerilyn B and Taylor Dan K
Bought by
Dubytskyi Vitalii and Dubytskyi Jenna Elaine
Home Financials for this Owner
Home Financials are based on the most recent Mortgage that was taken out on this home.
Original Mortgage
$380,000
Outstanding Balance
$344,043
Interest Rate
2.9%
Mortgage Type
New Conventional
Estimated Equity
$167,483
Purchase Details
Closed on
Aug 26, 2005
Sold by
Flaherty Sean L and Flaherty Alison M
Bought by
Taylor Jerilyn B and Taylor Dan K
Home Financials for this Owner
Home Financials are based on the most recent Mortgage that was taken out on this home.
Original Mortgage
$206,000
Interest Rate
5.78%
Mortgage Type
Fannie Mae Freddie Mac
Create a Home Valuation Report for This Property
The Home Valuation Report is an in-depth analysis detailing your home's value as well as a comparison with similar homes in the area
Home Values in the Area
Average Home Value in this Area
Purchase History
| Date | Buyer | Sale Price | Title Company |
|---|---|---|---|
| Dubytskyi Jenna Elaine | -- | None Available | |
| Dubytskyi Vitalii | $475,000 | Empire Title Co Springs Llc | |
| Taylor Jerilyn B | $257,500 | Stewart Title |
Source: Public Records
Mortgage History
| Date | Status | Borrower | Loan Amount |
|---|---|---|---|
| Open | Dubytskyi Vitalii | $380,000 | |
| Previous Owner | Taylor Jerilyn B | $206,000 |
Source: Public Records
Tax History Compared to Growth
Tax History
| Year | Tax Paid | Tax Assessment Tax Assessment Total Assessment is a certain percentage of the fair market value that is determined by local assessors to be the total taxable value of land and additions on the property. | Land | Improvement |
|---|---|---|---|---|
| 2025 | $1,756 | $36,300 | -- | -- |
| 2024 | $1,638 | $36,030 | $4,820 | $31,210 |
| 2023 | $1,638 | $36,030 | $4,820 | $31,210 |
| 2022 | $1,477 | $26,400 | $4,000 | $22,400 |
| 2021 | $1,602 | $27,150 | $4,110 | $23,040 |
| 2020 | $1,562 | $23,010 | $3,580 | $19,430 |
| 2019 | $1,553 | $23,010 | $3,580 | $19,430 |
| 2018 | $1,479 | $20,160 | $2,880 | $17,280 |
| 2017 | $1,401 | $20,160 | $2,880 | $17,280 |
| 2016 | $1,134 | $19,560 | $3,020 | $16,540 |
| 2015 | $1,130 | $19,560 | $3,020 | $16,540 |
| 2014 | $1,100 | $18,280 | $3,020 | $15,260 |
Source: Public Records
Map
Nearby Homes
- 5474 Jessica Ct
- 5450 Settlers Terrace
- 5162 Sunset Ridge Dr
- 5235 Quasar Ct
- 5050 Copernicus Way
- 5081 Willowbrook Rd
- 5105 Saddleback Heights
- 5242 Windgate Ct
- 5485 Castilian Villas Point
- 5747 Tradewind Point
- 4966 Galileo Dr
- 5040 Stillwater Dr
- 5123 Stillwater Dr
- 5125 Lewisia Point
- 4958 Wood Brook Ct
- 5119 Lewisia Point
- 5127 Rushford Place
- 5635 Altitude Dr
- 5169 Palomino Ranch Point
- 4842 S Old Brook Cir
- 5480 Cindy River Dr
- 5416 Cindy River Dr
- 5587 Rose Ridge Ln
- 5571 Rose Ridge Ln
- 5512 Cindy River Dr
- 5603 Rose Ridge Ln
- 5447 Cindy River Dr
- 5619 Rose Ridge Ln
- 5415 Cindy River Dr
- 5463 Cindy River Dr
- 5479 Cindy River Dr
- 5528 Cindy River Dr
- 5564 Rose Ridge Ln
- 5495 Cindy River Dr
- 5548 Rose Ridge Ln
- 5540R Rose Ridge Ln
- 5527 Rose Ridge Ln
- 5511 Cindy River Dr
- 5540 Rose Ridge Ln
- 5588 Rose Ridge Ln