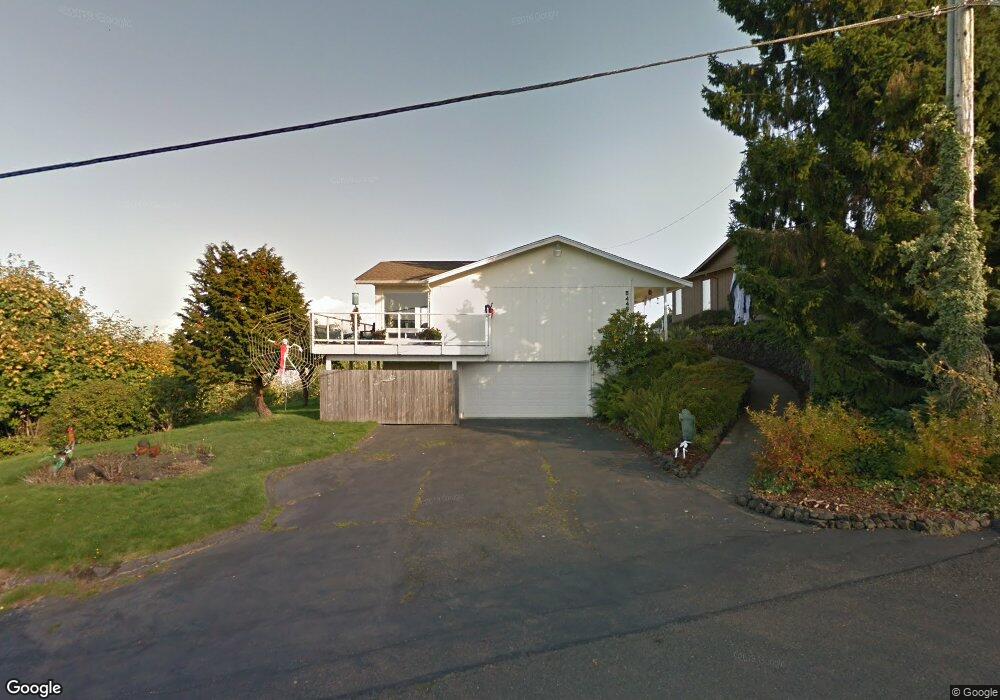
5448 Marian Dr NE Olympia, WA 98516
Estimated Value: $666,000 - $757,000
3
Beds
3
Baths
2,252
Sq Ft
$311/Sq Ft
Est. Value
About This Home
This home is located at 5448 Marian Dr NE, Olympia, WA 98516 and is currently estimated at $700,845, approximately $311 per square foot. 5448 Marian Dr NE is a home located in Thurston County with nearby schools including Olympic View Elementary School, Chinook Middle School, and North Thurston High School.
Ownership History
Date
Name
Owned For
Owner Type
Purchase Details
Closed on
May 30, 2006
Sold by
Bagby William Robinson and Japhet Peggy Ann
Bought by
Kennedy Patricia A
Current Estimated Value
Home Financials for this Owner
Home Financials are based on the most recent Mortgage that was taken out on this home.
Original Mortgage
$150,000
Interest Rate
6.52%
Mortgage Type
Unknown
Purchase Details
Closed on
Sep 16, 1997
Sold by
Japhet Floyd and Japhet Grace
Bought by
Bagby William Robinson and Japhet Peggy Ann
Purchase Details
Closed on
Jan 5, 1996
Sold by
Walk Mac Melvin and Walk Margaret M
Bought by
Japhet Floyd and Japhet Grace
Home Financials for this Owner
Home Financials are based on the most recent Mortgage that was taken out on this home.
Original Mortgage
$100,000
Interest Rate
7.36%
Mortgage Type
Seller Take Back
Create a Home Valuation Report for This Property
The Home Valuation Report is an in-depth analysis detailing your home's value as well as a comparison with similar homes in the area
Home Values in the Area
Average Home Value in this Area
Purchase History
| Date | Buyer | Sale Price | Title Company |
|---|---|---|---|
| Kennedy Patricia A | $400,000 | Chicago Title Co | |
| Bagby William Robinson | $290,000 | -- | |
| Japhet Floyd | -- | Transamerica Title Insurance |
Source: Public Records
Mortgage History
| Date | Status | Borrower | Loan Amount |
|---|---|---|---|
| Closed | Kennedy Patricia A | $150,000 | |
| Closed | Kennedy Patricia A | $25,000 | |
| Previous Owner | Japhet Floyd | $100,000 |
Source: Public Records
Tax History Compared to Growth
Tax History
| Year | Tax Paid | Tax Assessment Tax Assessment Total Assessment is a certain percentage of the fair market value that is determined by local assessors to be the total taxable value of land and additions on the property. | Land | Improvement |
|---|---|---|---|---|
| 2024 | $5,855 | $635,200 | $312,100 | $323,100 |
| 2023 | $5,855 | $584,100 | $249,800 | $334,300 |
| 2022 | $5,289 | $558,800 | $200,800 | $358,000 |
| 2021 | $5,040 | $431,400 | $145,300 | $286,100 |
| 2020 | $4,644 | $383,000 | $163,300 | $219,700 |
| 2019 | $4,096 | $362,100 | $126,800 | $235,300 |
| 2018 | $4,463 | $310,900 | $107,200 | $203,700 |
| 2017 | $4,008 | $289,650 | $101,350 | $188,300 |
| 2016 | $4,531 | $334,050 | $122,750 | $211,300 |
| 2014 | -- | $324,450 | $122,750 | $201,700 |
Source: Public Records
Map
Nearby Homes
- 5330 Yearley Dr NE
- 5400 Crestview Loop NE
- 5206 Waldron Dr NE
- 5311 Waldron Dr NE
- 5100 Marian Dr NE
- 5122 Yearley Dr NE
- 5036 Beach Way NE
- 4802 Delores Dr NE
- 8317 52nd Ave NE
- 4645 Gunvor Ct NE
- 4816 Center Ln NE
- 8240 Mossy Rock Ave NE
- 8524 46th Ct NE
- 4989 Spokane St NE
- 4961 Spokane St NE
- 8231 Orcas Loop NE
- 4921 Spokane Ct NE
- 4812 Spokane St NE
- 4411 Caddyshack Dr NE
- 4379 Dudley Ct NE
- 5436 Marian Dr NE
- 5504 Marian Dr NE
- 5430 Marian Dr NE
- 5512 Marian Dr NE
- 8726 Basin Dr NE
- 5433 Marian Dr NE
- 5420 Marian Dr NE
- 5440 Beverly Dr NE
- 5516 Marian Dr NE
- 5414 Marian Dr NE
- 5514 Beverly Dr NE
- 5416 Beverly Dr NE
- 5405 Marian Dr NE
- 5511 Beverly Dr NE
- 5520 Beverly Dr NE
- 5524 Marian Dr NE
- 5443 Beverly Dr NE
- 5400 Marian Dr NE
- 5410 Beverly Dr NE
- 5447 Beverly Dr NE