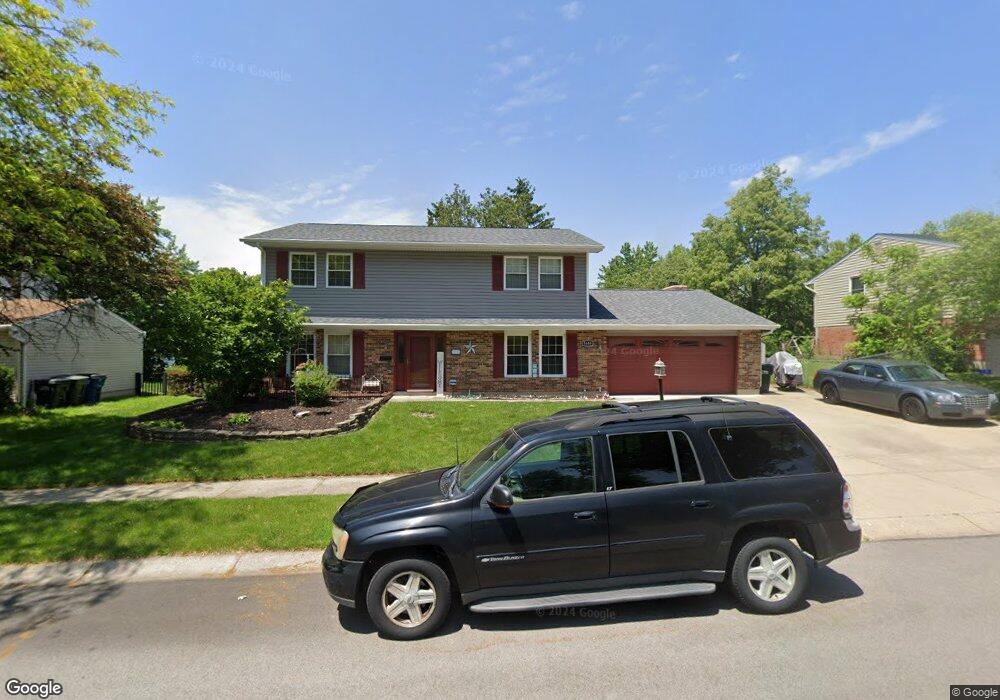
5449 Quisenberry Dr Dayton, OH 45424
Forest Ridge Quail Hollow NeighborhoodEstimated Value: $296,000 - $314,000
4
Beds
3
Baths
2,694
Sq Ft
$113/Sq Ft
Est. Value
About This Home
This home is located at 5449 Quisenberry Dr, Dayton, OH 45424 and is currently estimated at $305,479, approximately $113 per square foot. 5449 Quisenberry Dr is a home located in Montgomery County with nearby schools including Fairborn Primary School, Fairborn Intermediate School, and Fairborn Middle School.
Ownership History
Date
Name
Owned For
Owner Type
Purchase Details
Closed on
Nov 11, 2021
Sold by
Gresham Thomas M and Gresham Barbara D
Bought by
Coulton Stephen A and Coulton Katey A
Current Estimated Value
Home Financials for this Owner
Home Financials are based on the most recent Mortgage that was taken out on this home.
Original Mortgage
$140,000
Interest Rate
3.05%
Mortgage Type
New Conventional
Purchase Details
Closed on
Dec 14, 1999
Sold by
Bergman Daun D and Bergman Daun D
Bought by
Gresham Thomas M and Gresham Barbara D
Home Financials for this Owner
Home Financials are based on the most recent Mortgage that was taken out on this home.
Original Mortgage
$142,290
Interest Rate
7.87%
Mortgage Type
VA
Purchase Details
Closed on
Dec 6, 1999
Sold by
Bergman Mark A
Bought by
Bergman Daun D
Home Financials for this Owner
Home Financials are based on the most recent Mortgage that was taken out on this home.
Original Mortgage
$142,290
Interest Rate
7.87%
Mortgage Type
VA
Create a Home Valuation Report for This Property
The Home Valuation Report is an in-depth analysis detailing your home's value as well as a comparison with similar homes in the area
Home Values in the Area
Average Home Value in this Area
Purchase History
| Date | Buyer | Sale Price | Title Company |
|---|---|---|---|
| Coulton Stephen A | $205,000 | Prominent Title | |
| Gresham Thomas M | $139,500 | -- | |
| Bergman Daun D | -- | -- |
Source: Public Records
Mortgage History
| Date | Status | Borrower | Loan Amount |
|---|---|---|---|
| Closed | Coulton Stephen A | $140,000 | |
| Closed | Gresham Thomas M | $142,290 |
Source: Public Records
Tax History Compared to Growth
Tax History
| Year | Tax Paid | Tax Assessment Tax Assessment Total Assessment is a certain percentage of the fair market value that is determined by local assessors to be the total taxable value of land and additions on the property. | Land | Improvement |
|---|---|---|---|---|
| 2024 | $4,491 | $81,550 | $14,410 | $67,140 |
| 2023 | $4,491 | $81,550 | $14,410 | $67,140 |
| 2022 | $3,746 | $58,250 | $10,290 | $47,960 |
| 2021 | $3,776 | $58,250 | $10,290 | $47,960 |
| 2020 | $3,791 | $58,250 | $10,290 | $47,960 |
| 2019 | $3,215 | $49,290 | $9,800 | $39,490 |
| 2018 | $3,250 | $49,290 | $9,800 | $39,490 |
| 2017 | $3,182 | $49,290 | $9,800 | $39,490 |
| 2016 | $3,033 | $45,970 | $9,800 | $36,170 |
| 2015 | $2,860 | $45,970 | $9,800 | $36,170 |
| 2014 | $2,860 | $45,970 | $9,800 | $36,170 |
| 2012 | -- | $54,180 | $9,800 | $44,380 |
Source: Public Records
Map
Nearby Homes
- 4048 Quail Bush Dr
- 2757 Amberwood Dr Unit 17-300
- 4222 Meadowsweet Dr
- 4799 Blue Spruce Ct
- 0 Forest Ridge Blvd Unit 937866
- 5540 Signet Dr
- 4731 Blue Spruce Ct
- 4830 Leafburrow Dr
- 4426 Rainbrook Way
- 4403 Woodpoint Ct
- 3855 Berrywood Dr
- 4521 Willow Mist Dr
- 4288 Dobbin Cir
- 4294 Dobbin Cir
- 5224 Sweetleaf Dr
- 4418 Woodpoint Ct
- 5818 Royal Palm Ct
- 4750 Whitewood Ct
- 4734 Willow Mist Dr
- 3532 Berrywood Dr
- 5443 Quisenberry Dr
- 5455 Quisenberry Dr
- 4300 Pinecastle Ct
- 5437 Quisenberry Dr
- 5461 Quisenberry Dr
- 5454 Quisenberry Dr
- 5448 Quisenberry Dr
- 5442 Quisenberry Dr
- 4313 Pinecastle Ct
- 4312 Pinecastle Ct
- 5466 Quisenberry Dr
- 5467 Quisenberry Dr
- 5431 Quisenberry Dr
- 5438 Quisenberry Dr
- 4042 Quail Bush Dr
- 4054 Quail Bush Dr
- 5441 Split Rock Dr
- 4324 Pinecastle Ct
- 4325 Pinecastle Ct
- 5445 Split Rock Dr