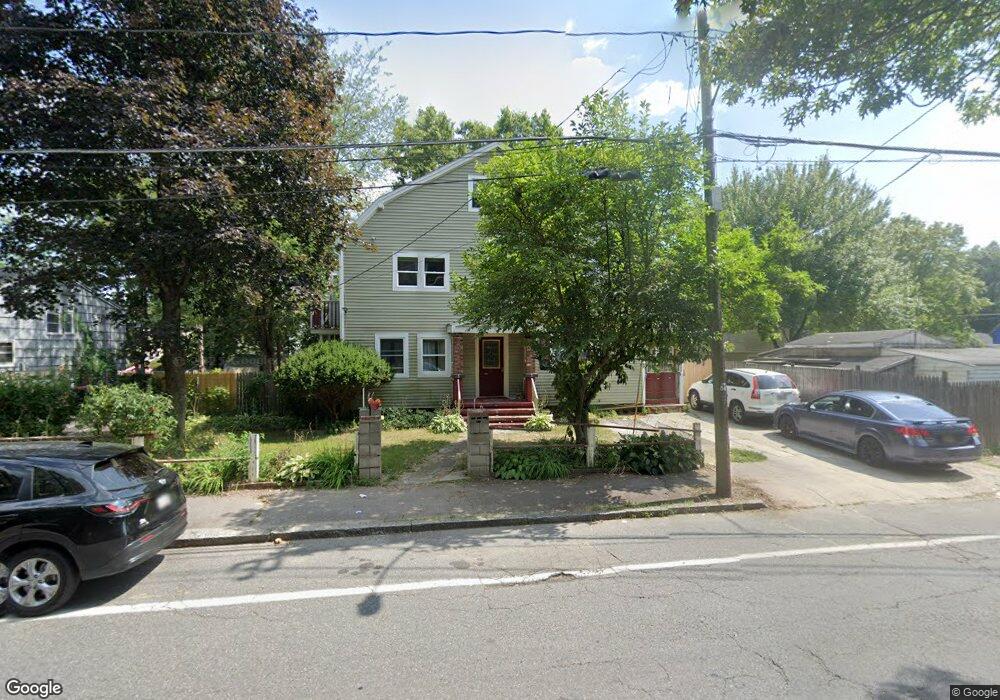
545 Court St Brockton, MA 02302
Estimated Value: $512,000 - $840,000
6
Beds
2
Baths
3,111
Sq Ft
$217/Sq Ft
Est. Value
About This Home
This home is located at 545 Court St, Brockton, MA 02302 and is currently estimated at $674,567, approximately $216 per square foot. 545 Court St is a home located in Plymouth County with nearby schools including Brookfield Elementary School, Downey Elementary School, and Ashfield Middle School.
Ownership History
Date
Name
Owned For
Owner Type
Purchase Details
Closed on
Mar 3, 2008
Sold by
Romulus Malie
Bought by
Romulus Rodney
Current Estimated Value
Purchase Details
Closed on
Aug 20, 2007
Sold by
Romulus Rodney
Bought by
Parisien Malie
Home Financials for this Owner
Home Financials are based on the most recent Mortgage that was taken out on this home.
Original Mortgage
$115,000
Interest Rate
6.78%
Purchase Details
Closed on
Jun 30, 1994
Sold by
Borneo Josephil H and Borneo Priscilla A
Bought by
Romulus Rodney
Home Financials for this Owner
Home Financials are based on the most recent Mortgage that was taken out on this home.
Original Mortgage
$65,700
Interest Rate
8.55%
Mortgage Type
Purchase Money Mortgage
Create a Home Valuation Report for This Property
The Home Valuation Report is an in-depth analysis detailing your home's value as well as a comparison with similar homes in the area
Home Values in the Area
Average Home Value in this Area
Purchase History
| Date | Buyer | Sale Price | Title Company |
|---|---|---|---|
| Romulus Rodney | -- | -- | |
| Parisien Malie | -- | -- | |
| Romulus Rodney | $73,000 | -- |
Source: Public Records
Mortgage History
| Date | Status | Borrower | Loan Amount |
|---|---|---|---|
| Previous Owner | Romulus Rodney | $115,000 | |
| Previous Owner | Romulus Rodney | $65,700 | |
| Previous Owner | Romulus Rodney | $62,000 | |
| Closed | Romulus Rodney | $4,148 |
Source: Public Records
Tax History Compared to Growth
Tax History
| Year | Tax Paid | Tax Assessment Tax Assessment Total Assessment is a certain percentage of the fair market value that is determined by local assessors to be the total taxable value of land and additions on the property. | Land | Improvement |
|---|---|---|---|---|
| 2025 | $6,315 | $521,500 | $144,300 | $377,200 |
| 2024 | $6,184 | $514,500 | $144,300 | $370,200 |
| 2023 | $5,644 | $434,800 | $109,100 | $325,700 |
| 2022 | $5,392 | $386,000 | $99,100 | $286,900 |
| 2021 | $5,079 | $350,300 | $92,300 | $258,000 |
| 2020 | $5,053 | $333,500 | $88,600 | $244,900 |
| 2019 | $4,618 | $297,200 | $82,300 | $214,900 |
| 2018 | $4,365 | $271,800 | $82,300 | $189,500 |
| 2017 | $4,229 | $262,700 | $82,300 | $180,400 |
| 2016 | $3,807 | $219,300 | $78,500 | $140,800 |
| 2015 | $3,882 | $213,900 | $78,500 | $135,400 |
| 2014 | $3,728 | $205,600 | $78,500 | $127,100 |
Source: Public Records
Map
Nearby Homes
- 34 Provost St
- 47 John Berman Dr
- 87 Sherman St
- 129 Anawan St
- 54 Mildred Rd
- 19 Ruth Rd
- 341 E Ashland St
- 47 Taber Ave
- 13 Standish St
- 18 N Manchester St
- 91 Hill St
- 383 Quincy St
- 230 Court St
- 590 E Ashland St
- 59 Sterling Rd
- 35 Errol Rd
- 115 Hill St
- 43 Pinehurst Ave
- 82 Debbie Rd Unit Lot 18
- 9 Massachusetts Ave