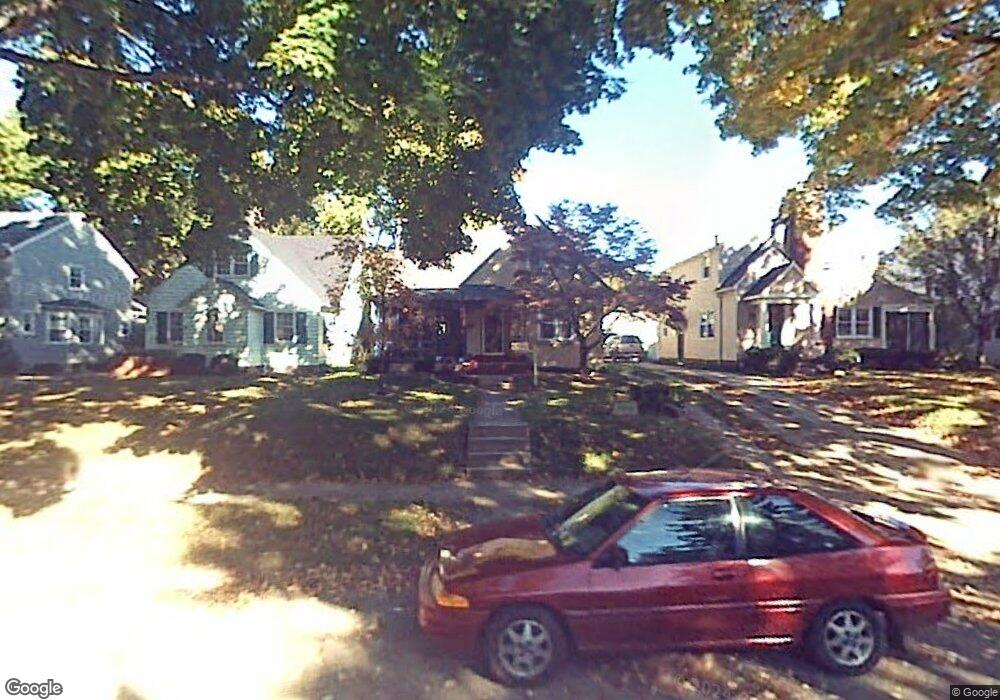
545 E Allen St Lancaster, OH 43130
Estimated Value: $248,363 - $299,000
3
Beds
2
Baths
1,362
Sq Ft
$199/Sq Ft
Est. Value
About This Home
This home is located at 545 E Allen St, Lancaster, OH 43130 and is currently estimated at $271,341, approximately $199 per square foot. 545 E Allen St is a home located in Fairfield County with nearby schools including Thomas Ewing Junior High School, Lancaster High School, and St Mary Elementary School.
Ownership History
Date
Name
Owned For
Owner Type
Purchase Details
Closed on
Mar 31, 2022
Sold by
Bunting Bradley D
Bought by
Decker Nikole L
Current Estimated Value
Home Financials for this Owner
Home Financials are based on the most recent Mortgage that was taken out on this home.
Original Mortgage
$150,000
Outstanding Balance
$138,860
Interest Rate
3.76%
Mortgage Type
Credit Line Revolving
Estimated Equity
$132,481
Purchase Details
Closed on
Nov 29, 2000
Sold by
Est Susan K Newman
Bought by
Bunting Bradley D and Decker Nikola L
Home Financials for this Owner
Home Financials are based on the most recent Mortgage that was taken out on this home.
Original Mortgage
$101,850
Interest Rate
7.86%
Mortgage Type
New Conventional
Purchase Details
Closed on
Jul 12, 1991
Sold by
Newman Eugene F
Bought by
Newman Susan K
Create a Home Valuation Report for This Property
The Home Valuation Report is an in-depth analysis detailing your home's value as well as a comparison with similar homes in the area
Home Values in the Area
Average Home Value in this Area
Purchase History
| Date | Buyer | Sale Price | Title Company |
|---|---|---|---|
| Decker Nikole L | -- | Dagger Johnston Miller Ogilvie | |
| Bunting Bradley D | $105,000 | -- | |
| Newman Susan K | -- | -- |
Source: Public Records
Mortgage History
| Date | Status | Borrower | Loan Amount |
|---|---|---|---|
| Open | Decker Nikole L | $150,000 | |
| Previous Owner | Bunting Bradley D | $101,850 |
Source: Public Records
Tax History
| Year | Tax Paid | Tax Assessment Tax Assessment Total Assessment is a certain percentage of the fair market value that is determined by local assessors to be the total taxable value of land and additions on the property. | Land | Improvement |
|---|---|---|---|---|
| 2025 | $6,333 | $98,020 | $19,730 | $78,290 |
| 2024 | $6,333 | $70,440 | $9,960 | $60,480 |
| 2023 | $2,563 | $70,440 | $9,960 | $60,480 |
| 2022 | $2,573 | $70,440 | $9,960 | $60,480 |
| 2021 | $2,203 | $56,490 | $9,960 | $46,530 |
| 2020 | $706 | $56,490 | $9,960 | $46,530 |
| 2019 | $2,007 | $56,490 | $9,960 | $46,530 |
| 2018 | $1,538 | $42,400 | $9,960 | $32,440 |
| 2017 | $1,538 | $41,110 | $9,580 | $31,530 |
| 2016 | $1,471 | $40,380 | $9,580 | $30,800 |
| 2015 | $1,464 | $39,020 | $9,580 | $29,440 |
| 2014 | $1,395 | $39,020 | $9,580 | $29,440 |
| 2013 | $1,395 | $39,020 | $9,580 | $29,440 |
Source: Public Records
Map
Nearby Homes
- 712 N Mount Pleasant Ave
- 617 N Maple St
- 705 Madison Ave
- 610 E 5th Ave
- 311 E Allen St
- 664 Smithfield Ave
- 600 N High St
- 717 N High St
- 648 King St
- 810 N Eastwood Ave
- 612 Oakwood Ave
- 731 Boyd St
- 224 King St
- 153 King St
- 701 Franklin Ave
- 17 Red Bud Ln
- 859 E Mulberry St
- 621 Harding Ave
- 869 E Mulberry St
- 130 W Fair Ave
- 535 E Allen St
- 547 E Allen St
- 549 E Allen St
- 531 E Allen St
- 525 E Allen St
- 555 E Allen St
- 540 Frederick St S
- 544 Frederick St S
- 559 E Allen St
- 544 Frederick St N
- 530 Frederick St S
- 705 N Mount Pleasant Ave
- 550 Frederick St S
- 550 Frederick St S
- 550 Frederick St
- 707 N Mount Pleasant Ave
- 519 E Allen St
- 561 E Allen St
- 711 N Mount Pleasant Ave
- 520 Frederick St
Your Personal Tour Guide
Ask me questions while you tour the home.