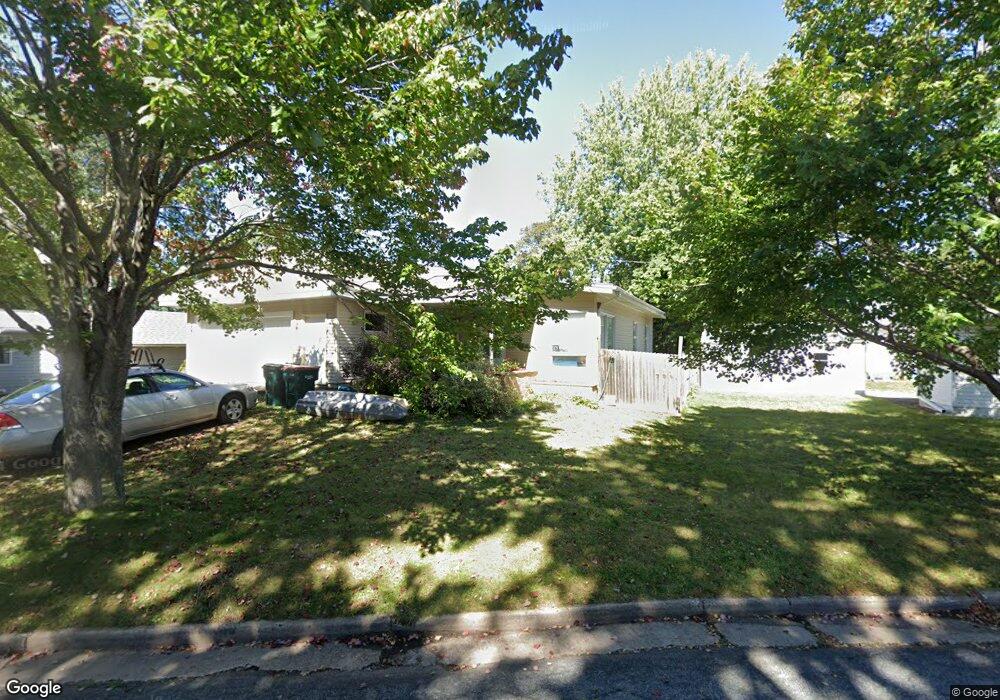
545 E Cedar St River Falls, WI 54022
Estimated Value: $249,000 - $303,000
3
Beds
2
Baths
--
Sq Ft
2,178
Sq Ft Lot
About This Home
This home is located at 545 E Cedar St, River Falls, WI 54022 and is currently estimated at $278,051. 545 E Cedar St is a home located in Pierce County with nearby schools including Greenwood Elementary School, Meyer Middle School, and River Falls High School.
Ownership History
Date
Name
Owned For
Owner Type
Purchase Details
Closed on
Oct 7, 2016
Sold by
Wittstock Zachary J and Wittstock Katie
Bought by
Hildebrandt Jeffery W
Current Estimated Value
Purchase Details
Closed on
Mar 30, 2008
Sold by
Anderson Jerome C and Melvin L Brown Family Trust
Bought by
Whittock Zachary J
Home Financials for this Owner
Home Financials are based on the most recent Mortgage that was taken out on this home.
Original Mortgage
$138,040
Interest Rate
6.09%
Mortgage Type
New Conventional
Create a Home Valuation Report for This Property
The Home Valuation Report is an in-depth analysis detailing your home's value as well as a comparison with similar homes in the area
Home Values in the Area
Average Home Value in this Area
Purchase History
| Date | Buyer | Sale Price | Title Company |
|---|---|---|---|
| Hildebrandt Jeffery W | $155,000 | None Available | |
| Whittock Zachary J | $140,000 | Title One |
Source: Public Records
Mortgage History
| Date | Status | Borrower | Loan Amount |
|---|---|---|---|
| Previous Owner | Whittock Zachary J | $138,040 |
Source: Public Records
Tax History
| Year | Tax Paid | Tax Assessment Tax Assessment Total Assessment is a certain percentage of the fair market value that is determined by local assessors to be the total taxable value of land and additions on the property. | Land | Improvement |
|---|---|---|---|---|
| 2025 | $3,977 | $242,400 | $31,700 | $210,700 |
| 2024 | $3,807 | $180,400 | $24,400 | $156,000 |
| 2023 | $3,699 | $180,400 | $24,400 | $156,000 |
| 2022 | $2,995 | $180,400 | $24,400 | $156,000 |
| 2021 | $2,984 | $180,400 | $24,400 | $156,000 |
| 2020 | $2,650 | $114,000 | $19,500 | $94,500 |
| 2019 | $2,454 | $114,000 | $19,500 | $94,500 |
| 2018 | $2,475 | $114,000 | $19,500 | $94,500 |
| 2017 | $2,422 | $114,000 | $19,500 | $94,500 |
| 2016 | $2,309 | $114,000 | $19,500 | $94,500 |
| 2015 | $2,364 | $114,000 | $19,500 | $94,500 |
| 2014 | $2,712 | $148,000 | $23,800 | $124,200 |
| 2013 | $2,784 | $148,000 | $23,800 | $124,200 |
Source: Public Records
Map
Nearby Homes
Your Personal Tour Guide
Ask me questions while you tour the home.