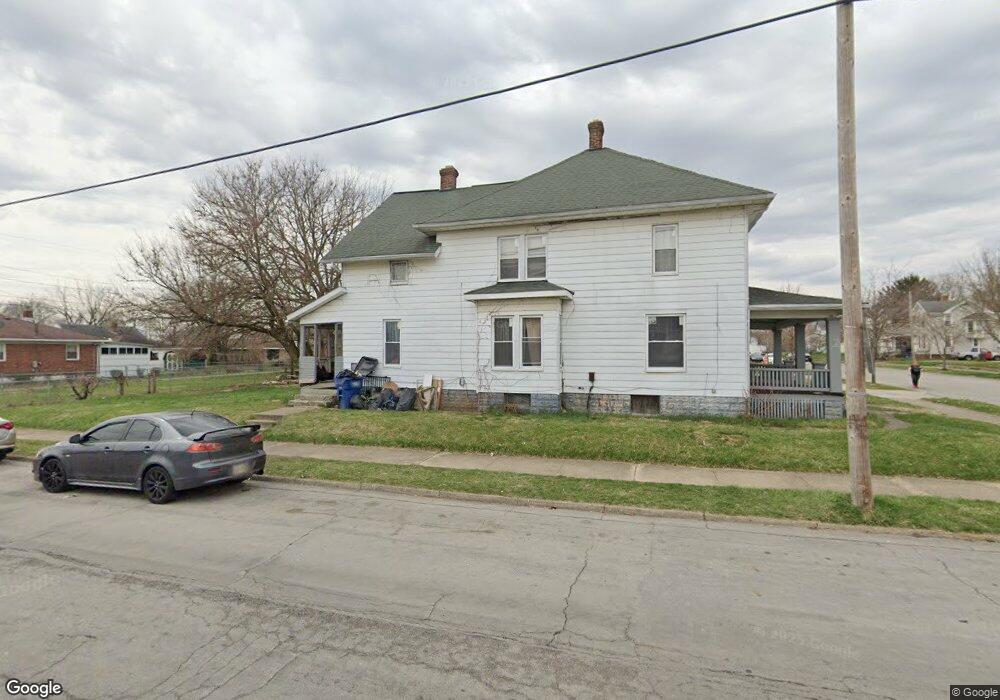
545 E Rose St Unit 547 Springfield, OH 45505
Estimated Value: $37,866 - $121,000
4
Beds
2
Baths
2,328
Sq Ft
$34/Sq Ft
Est. Value
About This Home
This home is located at 545 E Rose St Unit 547, Springfield, OH 45505 and is currently estimated at $78,217, approximately $33 per square foot. 545 E Rose St Unit 547 is a home located in Clark County with nearby schools including Lincoln Elementary School, Hayward Middle School, and Springfield High School.
Ownership History
Date
Name
Owned For
Owner Type
Purchase Details
Closed on
Dec 18, 2024
Sold by
Otstot Auto-Sales Llc
Bought by
Petes Corner Bar Llc
Current Estimated Value
Purchase Details
Closed on
Jan 22, 2021
Sold by
Witherspoon Emil M
Bought by
Otstot Auto Sales Llc
Purchase Details
Closed on
Jan 22, 2020
Sold by
Witherspoon Emil M
Bought by
Otstot Auto-Sales Llc
Purchase Details
Closed on
Apr 7, 2017
Sold by
Tennant Kent S and Witherspoon Emil M
Bought by
Witherspoon Emil M
Purchase Details
Closed on
Dec 22, 1995
Sold by
Shrf James A Terhune Pr
Bought by
Tennant Kent S and Tennant Brenda
Home Financials for this Owner
Home Financials are based on the most recent Mortgage that was taken out on this home.
Original Mortgage
$52,906
Interest Rate
8.62%
Mortgage Type
New Conventional
Purchase Details
Closed on
May 17, 1988
Create a Home Valuation Report for This Property
The Home Valuation Report is an in-depth analysis detailing your home's value as well as a comparison with similar homes in the area
Home Values in the Area
Average Home Value in this Area
Purchase History
| Date | Buyer | Sale Price | Title Company |
|---|---|---|---|
| Petes Corner Bar Llc | -- | Team Title & Closing Services | |
| Otstot Auto Sales Llc | $22,500 | Team Ttl & Closing Svcs Llc | |
| Otstot Auto-Sales Llc | -- | Alton Lane | |
| Witherspoon Emil M | $7,500 | None Available | |
| Tennant Kent S | $25,000 | -- | |
| -- | $15,000 | -- |
Source: Public Records
Mortgage History
| Date | Status | Borrower | Loan Amount |
|---|---|---|---|
| Previous Owner | Tennant Kent S | $52,906 |
Source: Public Records
Tax History
| Year | Tax Paid | Tax Assessment Tax Assessment Total Assessment is a certain percentage of the fair market value that is determined by local assessors to be the total taxable value of land and additions on the property. | Land | Improvement |
|---|---|---|---|---|
| 2025 | $1,393 | $17,480 | $1,480 | $16,000 |
| 2024 | $990 | $12,930 | $1,280 | $11,650 |
| 2023 | $1,407 | $12,930 | $1,280 | $11,650 |
| 2022 | $1,014 | $12,930 | $1,280 | $11,650 |
| 2021 | $587 | $10,690 | $1,060 | $9,630 |
| 2020 | $589 | $10,690 | $1,060 | $9,630 |
| 2019 | $590 | $10,690 | $1,060 | $9,630 |
| 2018 | $541 | $9,400 | $880 | $8,520 |
| 2017 | $683 | $11,890 | $882 | $11,008 |
| 2016 | $684 | $11,890 | $882 | $11,008 |
| 2015 | $370 | $11,459 | $882 | $10,577 |
| 2014 | $670 | $11,459 | $882 | $10,577 |
| 2013 | $663 | $11,459 | $882 | $10,577 |
Source: Public Records
Map
Nearby Homes
- 550 E Rose St
- 1502 Linden Ave
- 652 E Southern Ave
- 900 E Rose St
- 230 Rice St
- 1008 Tibbetts Ave
- 1724 Clay St
- 441 E Euclid Ave
- 1417 Clifton Ave Unit 1419
- 205 E Grand Ave
- 1820 Clay St
- 1823 Clay St
- 1111 Lafayette Ave
- 1846 Ohio Ave
- 705 York St
- 0 W Perrin Ave Unit 1043508
- 0 W Perrin Ave Unit 951292
- 625 Tibbetts Ave
- 1355 S Fountain Ave
- 718 Summer St
Your Personal Tour Guide
Ask me questions while you tour the home.