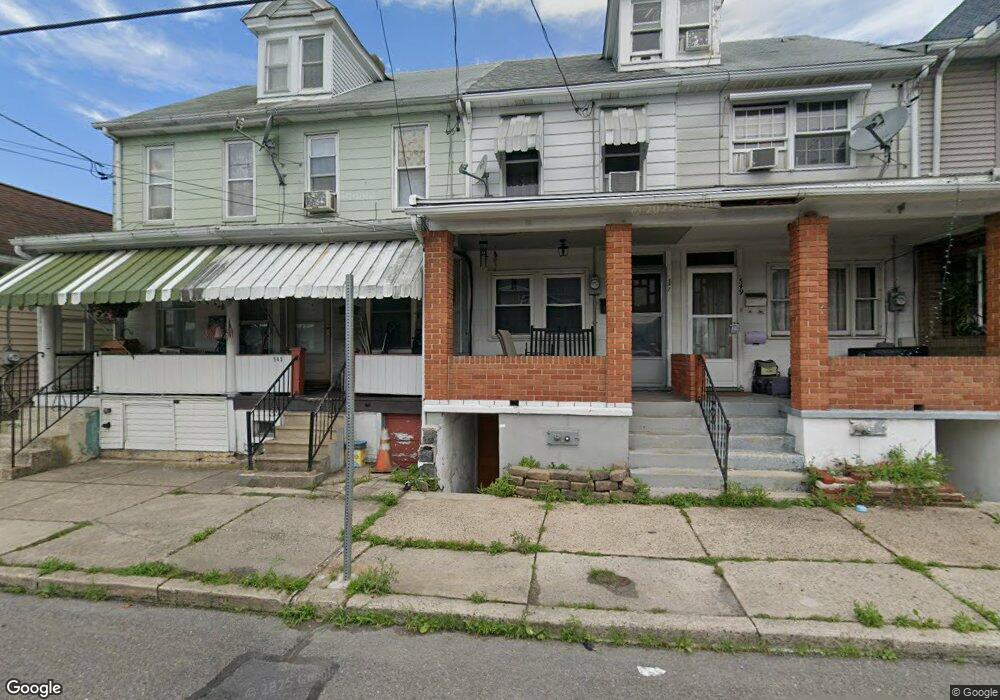
545 E Union St Tamaqua, PA 18252
Estimated Value: $71,893 - $92,000
3
Beds
1
Bath
1,190
Sq Ft
$68/Sq Ft
Est. Value
About This Home
This home is located at 545 E Union St, Tamaqua, PA 18252 and is currently estimated at $81,473, approximately $68 per square foot. 545 E Union St is a home located in Schuylkill County with nearby schools including Tamaqua Area Senior High School and Marian Catholic High School.
Ownership History
Date
Name
Owned For
Owner Type
Purchase Details
Closed on
Apr 28, 2011
Sold by
Federal National Mortgage Association
Bought by
Otto Joe
Current Estimated Value
Purchase Details
Closed on
Mar 11, 2011
Sold by
Hudak Eileen M
Bought by
Federal National Mortgage Association
Purchase Details
Closed on
Jun 7, 2006
Sold by
Pratt Ronald W
Bought by
Hudak Eileen M
Home Financials for this Owner
Home Financials are based on the most recent Mortgage that was taken out on this home.
Original Mortgage
$24,000
Interest Rate
6.62%
Mortgage Type
New Conventional
Purchase Details
Closed on
May 30, 2006
Sold by
Pratt Ronald W and Kemmerer Krista A
Bought by
Pratt Ronald W
Home Financials for this Owner
Home Financials are based on the most recent Mortgage that was taken out on this home.
Original Mortgage
$24,000
Interest Rate
6.62%
Mortgage Type
New Conventional
Purchase Details
Closed on
Jan 5, 2006
Sold by
Pratt Krista Kemmerer
Bought by
Pratt Ronald W
Create a Home Valuation Report for This Property
The Home Valuation Report is an in-depth analysis detailing your home's value as well as a comparison with similar homes in the area
Home Values in the Area
Average Home Value in this Area
Purchase History
| Date | Buyer | Sale Price | Title Company |
|---|---|---|---|
| Otto Joe | $15,000 | None Available | |
| Federal National Mortgage Association | $924 | None Available | |
| Hudak Eileen M | $30,000 | None Available | |
| Pratt Ronald W | -- | None Available | |
| Pratt Ronald W | -- | None Available |
Source: Public Records
Mortgage History
| Date | Status | Borrower | Loan Amount |
|---|---|---|---|
| Previous Owner | Hudak Eileen M | $24,000 | |
| Previous Owner | Pratt Ronald W | $24,000 |
Source: Public Records
Tax History
| Year | Tax Paid | Tax Assessment Tax Assessment Total Assessment is a certain percentage of the fair market value that is determined by local assessors to be the total taxable value of land and additions on the property. | Land | Improvement |
|---|---|---|---|---|
| 2025 | $1,272 | $14,565 | $3,750 | $10,815 |
| 2024 | $1,178 | $14,565 | $3,750 | $10,815 |
| 2023 | $1,178 | $14,565 | $3,750 | $10,815 |
| 2022 | $1,147 | $14,565 | $3,750 | $10,815 |
| 2021 | $1,141 | $14,565 | $3,750 | $10,815 |
| 2020 | $1,117 | $14,565 | $3,750 | $10,815 |
| 2018 | $1,082 | $14,565 | $3,750 | $10,815 |
| 2017 | $1,050 | $14,565 | $3,750 | $10,815 |
| 2015 | -- | $14,565 | $3,750 | $10,815 |
| 2011 | -- | $14,565 | $0 | $0 |
Source: Public Records
Map
Nearby Homes
Your Personal Tour Guide
Ask me questions while you tour the home.