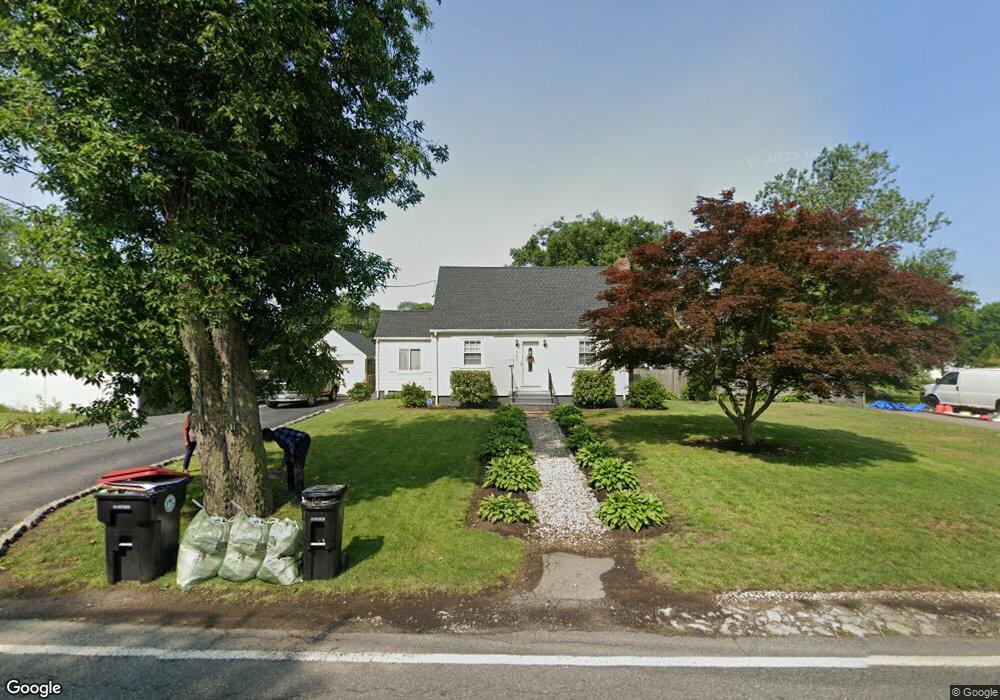
545 East St Brockton, MA 02302
Estimated Value: $385,000 - $441,929
3
Beds
1
Bath
941
Sq Ft
$450/Sq Ft
Est. Value
About This Home
This home is located at 545 East St, Brockton, MA 02302 and is currently estimated at $423,482, approximately $450 per square foot. 545 East St is a home located in Plymouth County with nearby schools including Davis K-8 School, John F. Kennedy Elementary School, and South Middle School.
Ownership History
Date
Name
Owned For
Owner Type
Purchase Details
Closed on
Sep 16, 1987
Sold by
Badger Ronald E
Bought by
Townsend Julia E
Current Estimated Value
Purchase Details
Closed on
Jun 8, 1987
Sold by
545 East Realty Tr
Bought by
Badger Ronald E
Create a Home Valuation Report for This Property
The Home Valuation Report is an in-depth analysis detailing your home's value as well as a comparison with similar homes in the area
Home Values in the Area
Average Home Value in this Area
Purchase History
| Date | Buyer | Sale Price | Title Company |
|---|---|---|---|
| Townsend Julia E | $129,900 | -- | |
| Badger Ronald E | $106,900 | -- |
Source: Public Records
Mortgage History
| Date | Status | Borrower | Loan Amount |
|---|---|---|---|
| Open | Badger Ronald E | $139,110 | |
| Closed | Badger Ronald E | $123,009 | |
| Closed | Badger Ronald E | $3,000 |
Source: Public Records
Tax History Compared to Growth
Tax History
| Year | Tax Paid | Tax Assessment Tax Assessment Total Assessment is a certain percentage of the fair market value that is determined by local assessors to be the total taxable value of land and additions on the property. | Land | Improvement |
|---|---|---|---|---|
| 2025 | $3,996 | $330,000 | $165,000 | $165,000 |
| 2024 | $3,868 | $321,800 | $165,000 | $156,800 |
| 2023 | $4,334 | $333,900 | $115,500 | $218,400 |
| 2022 | $4,060 | $290,600 | $105,000 | $185,600 |
| 2021 | $3,626 | $250,100 | $99,000 | $151,100 |
| 2020 | $3,845 | $253,800 | $86,300 | $167,500 |
| 2019 | $3,487 | $224,400 | $83,000 | $141,400 |
| 2018 | $3,254 | $202,600 | $83,000 | $119,600 |
| 2017 | $3,011 | $187,000 | $83,000 | $104,000 |
| 2016 | $2,993 | $172,400 | $79,100 | $93,300 |
| 2015 | $2,866 | $157,900 | $79,100 | $78,800 |
| 2014 | $2,680 | $147,800 | $79,100 | $68,700 |
Source: Public Records
Map
Nearby Homes