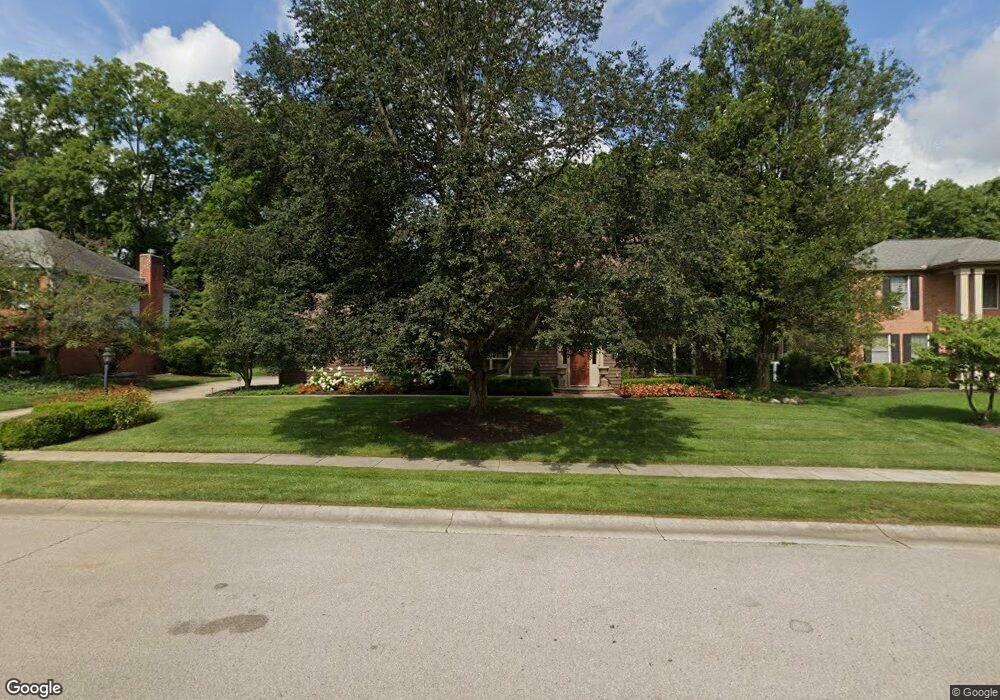
545 Evergreen Dr Springboro, OH 45066
Estimated Value: $382,260 - $427,000
4
Beds
3
Baths
2,228
Sq Ft
$182/Sq Ft
Est. Value
About This Home
This home is located at 545 Evergreen Dr, Springboro, OH 45066 and is currently estimated at $404,815, approximately $181 per square foot. 545 Evergreen Dr is a home located in Warren County with nearby schools including Clearcreek Elementary School, Springboro Intermediate School, and Dennis Elementary School.
Ownership History
Date
Name
Owned For
Owner Type
Purchase Details
Closed on
Feb 27, 2004
Sold by
Franz David N and Franz Michele M
Bought by
Franz Michele M and Revocable Living Tr Agreement Michele M
Current Estimated Value
Home Financials for this Owner
Home Financials are based on the most recent Mortgage that was taken out on this home.
Original Mortgage
$145,000
Interest Rate
5.71%
Mortgage Type
New Conventional
Purchase Details
Closed on
Apr 14, 1994
Sold by
Nicholson Nicholson and Nicholson William S
Bought by
Franz Franz and Franz David N
Purchase Details
Closed on
Oct 4, 1988
Sold by
Middendorf Craig and Middendorf Melva
Bought by
Nicholson and Nicholson William S
Purchase Details
Closed on
Dec 31, 1986
Sold by
Terrill Terrill and Terrill David
Bought by
Middendorf Middendorf and Middendorf Craig
Purchase Details
Closed on
Oct 6, 1986
Sold by
Terrill Terrill and Terrill David
Bought by
Terrill Terrill and Terrill David
Create a Home Valuation Report for This Property
The Home Valuation Report is an in-depth analysis detailing your home's value as well as a comparison with similar homes in the area
Home Values in the Area
Average Home Value in this Area
Purchase History
| Date | Buyer | Sale Price | Title Company |
|---|---|---|---|
| Franz Michele M | -- | -- | |
| Franz David N | -- | -- | |
| Franz Franz | $198,000 | -- | |
| Nicholson | $165,000 | -- | |
| Middendorf Middendorf | $22,500 | -- | |
| Terrill Terrill | -- | -- |
Source: Public Records
Mortgage History
| Date | Status | Borrower | Loan Amount |
|---|---|---|---|
| Closed | Franz David N | $145,000 |
Source: Public Records
Tax History
| Year | Tax Paid | Tax Assessment Tax Assessment Total Assessment is a certain percentage of the fair market value that is determined by local assessors to be the total taxable value of land and additions on the property. | Land | Improvement |
|---|---|---|---|---|
| 2025 | $3,949 | $101,130 | $31,500 | $69,630 |
| 2024 | $3,949 | $101,130 | $31,500 | $69,630 |
| 2023 | $3,313 | $77,787 | $16,940 | $60,847 |
| 2022 | $3,264 | $77,788 | $16,940 | $60,848 |
| 2021 | $3,037 | $77,788 | $16,940 | $60,848 |
| 2020 | $2,871 | $64,288 | $14,000 | $50,288 |
| 2019 | $2,647 | $64,288 | $14,000 | $50,288 |
| 2018 | $2,649 | $64,288 | $14,000 | $50,288 |
| 2017 | $2,534 | $55,388 | $12,250 | $43,138 |
| 2016 | $2,643 | $55,388 | $12,250 | $43,138 |
| 2015 | $2,613 | $55,388 | $12,250 | $43,138 |
| 2014 | $2,613 | $51,770 | $11,450 | $40,320 |
| 2013 | $2,611 | $63,300 | $14,000 | $49,300 |
Source: Public Records
Map
Nearby Homes
- 350 Spruceway Dr
- 510 Royal Springs Dr
- 340 Saint James Place
- 245 Whispering Pines St
- 1101 Parklake Row
- 9680 Williams Dr
- 23 Pheasant Run Cir Unit 9A
- 225 Renwood Place
- 11138 Oakwood Village Blvd
- 3760 Pennyroyal Rd
- 1785 Archerfield Place
- 20 Terradyne Trace
- 4 Chestnut St
- 72 Pebble Brook Place
- 10862 Jandor Place
- 50 Millard Ct
- 35 Edgebrooke Dr
- 4193 Old Osprey Cir
- 70 Eleanor Dr
- 10 Woods Rd
- 555 Evergreen Dr
- 535 Evergreen Dr
- 565 Evergreen Dr
- 540 Evergreen Dr
- 530 Evergreen Dr
- 550 Evergreen Dr
- 520 Evergreen Dr
- 571 Evergreen Dr
- 515 Evergreen Dr
- 560 Evergreen Dr
- 537 King George Ct
- 524 King George Ct
- 577 Evergreen Dr
- 570 Evergreen Dr
- 2940 Westminster Way
- 505 Evergreen Dr
- 25 Dogwood Ct
- 2930 Westminster Way
- 2920 Westminster Way
- 580 Evergreen Dr
Your Personal Tour Guide
Ask me questions while you tour the home.