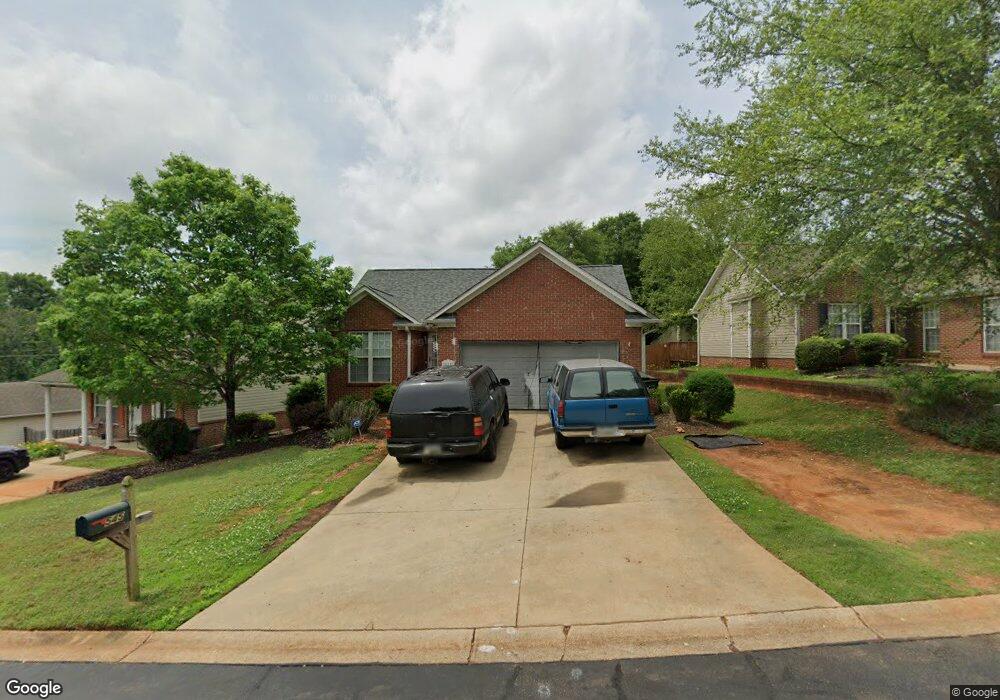
545 Fawn Branch Trail Boiling Springs, SC 29316
Estimated Value: $213,000 - $237,000
3
Beds
2
Baths
1,210
Sq Ft
$184/Sq Ft
Est. Value
About This Home
This home is located at 545 Fawn Branch Trail, Boiling Springs, SC 29316 and is currently estimated at $222,738, approximately $184 per square foot. 545 Fawn Branch Trail is a home located in Spartanburg County with nearby schools including Boiling Springs Middle School, Boiling Springs High School, and Spartanburg Christian Academy.
Ownership History
Date
Name
Owned For
Owner Type
Purchase Details
Closed on
Dec 20, 2014
Sold by
Rice Melvin S
Bought by
Rice Rena G and Rice Melvin S
Current Estimated Value
Purchase Details
Closed on
Sep 24, 2012
Sold by
Rice Marcellious
Bought by
Rice Melvin S and Rice Marcellious
Purchase Details
Closed on
Mar 3, 2006
Sold by
Michael Ann E and Perry Melissa A
Bought by
Rice Marcellious
Home Financials for this Owner
Home Financials are based on the most recent Mortgage that was taken out on this home.
Original Mortgage
$68,000
Outstanding Balance
$38,476
Interest Rate
6.19%
Mortgage Type
New Conventional
Estimated Equity
$184,262
Purchase Details
Closed on
Dec 12, 2003
Sold by
Lawson & Lawson Builders Inc
Bought by
Michael Ann E
Purchase Details
Closed on
May 21, 2003
Sold by
Lynch A Manning
Bought by
Lawson & Lawson Builders Inc
Create a Home Valuation Report for This Property
The Home Valuation Report is an in-depth analysis detailing your home's value as well as a comparison with similar homes in the area
Home Values in the Area
Average Home Value in this Area
Purchase History
| Date | Buyer | Sale Price | Title Company |
|---|---|---|---|
| Rice Rena G | -- | -- | |
| Rice Melvin S | -- | -- | |
| Rice Marcellious | $113,000 | None Available | |
| Michael Ann E | $109,777 | -- | |
| Lawson & Lawson Builders Inc | $31,800 | -- |
Source: Public Records
Mortgage History
| Date | Status | Borrower | Loan Amount |
|---|---|---|---|
| Open | Rice Marcellious | $68,000 |
Source: Public Records
Tax History Compared to Growth
Tax History
| Year | Tax Paid | Tax Assessment Tax Assessment Total Assessment is a certain percentage of the fair market value that is determined by local assessors to be the total taxable value of land and additions on the property. | Land | Improvement |
|---|---|---|---|---|
| 2025 | $898 | $6,136 | $961 | $5,175 |
| 2024 | $898 | $6,136 | $961 | $5,175 |
| 2023 | $898 | $6,136 | $961 | $5,175 |
| 2022 | $778 | $5,336 | $743 | $4,593 |
| 2021 | $777 | $5,336 | $743 | $4,593 |
| 2020 | $764 | $5,336 | $743 | $4,593 |
| 2019 | $764 | $5,336 | $743 | $4,593 |
| 2018 | $746 | $5,336 | $743 | $4,593 |
| 2017 | $638 | $4,640 | $800 | $3,840 |
| 2016 | $642 | $4,640 | $800 | $3,840 |
| 2015 | $638 | $6,960 | $1,200 | $5,760 |
| 2014 | $2,535 | $4,640 | $800 | $3,840 |
Source: Public Records
Map
Nearby Homes
- 618 Fawn Branch Trail
- 162 Clearcreek Dr
- 209 Harvest Ln
- 3044 English Cottage Way
- 509 Wentworth Farm Cir
- 1015 Tudor Cottage Tr
- 225 Watersedge Dr
- 3031 English Cottage Way
- 3027 English Cottage Way
- 4038 Hoskins Dr
- 813 Batten Cottage Ct
- 4030 Hoskins Dr
- 6011 Beasley Ct
- 6007 Beasley Ct
- 6014 Beasley Ct
- 4026 Hoskins Dr
- 4033 Hoskins Dr
- 812 Batten Cottage Ct
- 3008 English Cottage Way
- 5002 Atkins Way
- 539 Fawn Branch Trail
- 551 Fawn Branch Trail
- Lot 1 Fawn Branch Trail
- 535 Fawn Branch Trail
- 555 Fawn Branch Trail
- 107 Shining Rock Ct
- 610 Diamond Valley Ct
- 550 Fawn Branch Trail
- 546 Fawn Branch Trail
- 115 Shining Rock Ct
- 554 Fawn Branch Trail
- 542 Fawn Branch Trail
- 558 Fawn Branch Trail
- 119 Shining Rock Ct
- 538 Fawn Branch Trail
- 567 Fawn Branch Trail
- 521 Fawn Branch Trail
- 609 Diamond Valley Ct
- 534 Fawn Branch Trail
- 530 Fawn Branch Trail