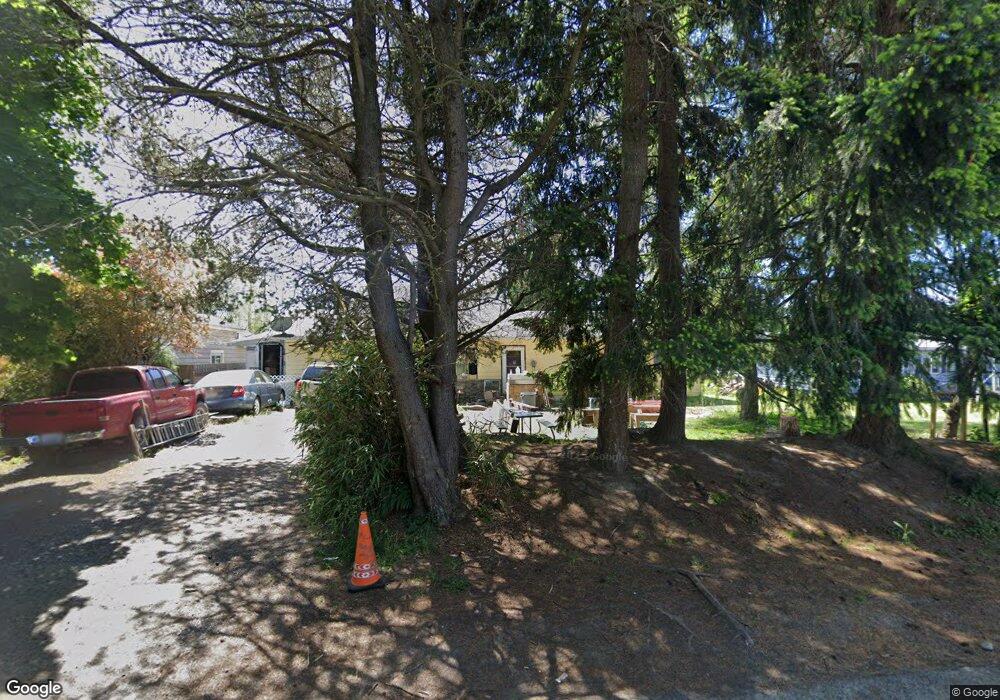
545 G St Blaine, WA 98230
Estimated Value: $484,000 - $536,000
3
Beds
1
Bath
1,874
Sq Ft
$271/Sq Ft
Est. Value
About This Home
This home is located at 545 G St, Blaine, WA 98230 and is currently estimated at $507,805, approximately $270 per square foot. 545 G St is a home located in Whatcom County with nearby schools including Blaine Primary School, Blaine Elementary School, and Blaine Middle School.
Ownership History
Date
Name
Owned For
Owner Type
Purchase Details
Closed on
Jun 5, 2003
Sold by
Pacific Homes/Homequest Inc
Bought by
Jorgensen Brian L and Jorgensen Rhonda K
Current Estimated Value
Home Financials for this Owner
Home Financials are based on the most recent Mortgage that was taken out on this home.
Original Mortgage
$147,682
Outstanding Balance
$63,893
Interest Rate
5.61%
Mortgage Type
FHA
Estimated Equity
$443,912
Purchase Details
Closed on
Aug 14, 2001
Sold by
Charuk Geneva G
Bought by
Pacific Homes/Homequest Inc
Create a Home Valuation Report for This Property
The Home Valuation Report is an in-depth analysis detailing your home's value as well as a comparison with similar homes in the area
Home Values in the Area
Average Home Value in this Area
Purchase History
| Date | Buyer | Sale Price | Title Company |
|---|---|---|---|
| Jorgensen Brian L | $150,000 | Stewart Title Company | |
| Pacific Homes/Homequest Inc | $82,000 | First American Title Insuran |
Source: Public Records
Mortgage History
| Date | Status | Borrower | Loan Amount |
|---|---|---|---|
| Open | Jorgensen Brian L | $147,682 |
Source: Public Records
Tax History Compared to Growth
Tax History
| Year | Tax Paid | Tax Assessment Tax Assessment Total Assessment is a certain percentage of the fair market value that is determined by local assessors to be the total taxable value of land and additions on the property. | Land | Improvement |
|---|---|---|---|---|
| 2024 | $2,633 | $390,797 | $144,300 | $246,497 |
| 2023 | $2,633 | $390,797 | $144,300 | $246,497 |
| 2022 | $2,599 | $352,069 | $130,000 | $222,069 |
| 2021 | $2,478 | $297,766 | $107,341 | $190,425 |
| 2020 | $2,358 | $258,927 | $93,340 | $165,587 |
| 2019 | $2,196 | $237,109 | $85,475 | $151,634 |
| 2018 | $2,041 | $215,472 | $77,675 | $137,797 |
| 2017 | $1,820 | $180,311 | $65,000 | $115,311 |
| 2016 | $1,770 | $180,311 | $65,000 | $115,311 |
| 2015 | $1,734 | $169,167 | $55,204 | $113,963 |
| 2014 | -- | $161,888 | $52,828 | $109,060 |
| 2013 | -- | $160,122 | $52,250 | $107,872 |
Source: Public Records
Map
Nearby Homes