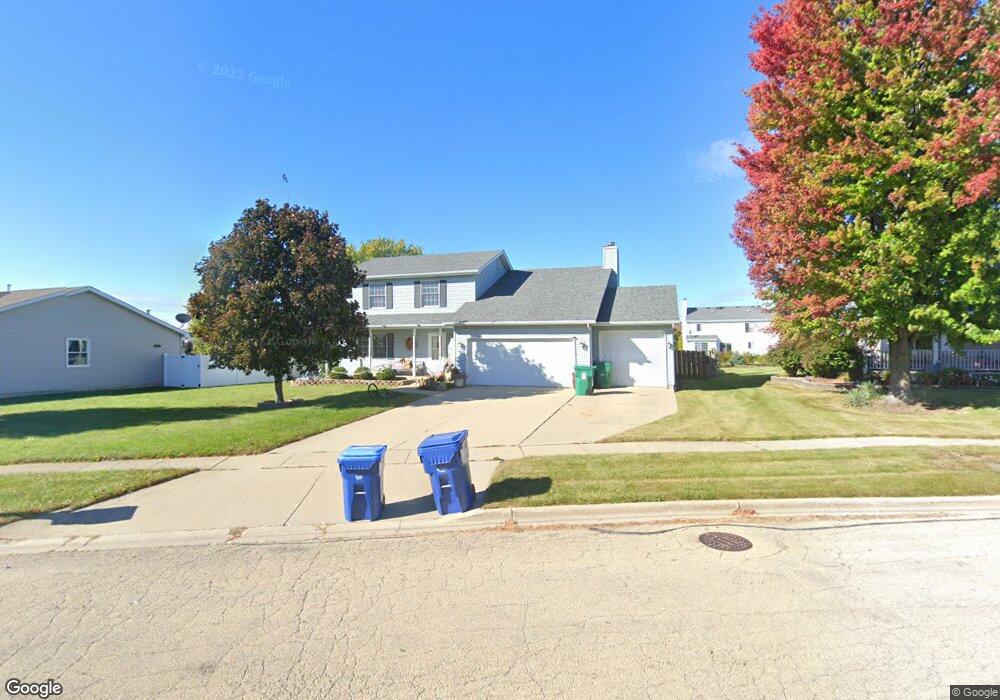
545 Jasmine St Dekalb, IL 60115
Estimated Value: $295,000 - $322,000
4
Beds
7
Baths
1,700
Sq Ft
$179/Sq Ft
Est. Value
About This Home
This home is located at 545 Jasmine St, Dekalb, IL 60115 and is currently estimated at $304,578, approximately $179 per square foot. 545 Jasmine St is a home located in DeKalb County with nearby schools including Founders Elementary School, Huntley Middle School, and De Kalb High School.
Ownership History
Date
Name
Owned For
Owner Type
Purchase Details
Closed on
Nov 13, 2021
Sold by
Heuer Justin and Davis Annette
Bought by
Marquez Michael
Current Estimated Value
Home Financials for this Owner
Home Financials are based on the most recent Mortgage that was taken out on this home.
Original Mortgage
$180,500
Interest Rate
3.11%
Mortgage Type
New Conventional
Purchase Details
Closed on
Dec 31, 2008
Sold by
Heuer Justin
Bought by
Heuer Justin and Davis Annette
Purchase Details
Closed on
Nov 23, 2007
Sold by
Fannie Mae
Bought by
Heuer Justin
Home Financials for this Owner
Home Financials are based on the most recent Mortgage that was taken out on this home.
Original Mortgage
$151,920
Interest Rate
6.33%
Mortgage Type
New Conventional
Purchase Details
Closed on
Jul 16, 2007
Sold by
Dekalb County Sheriff
Bought by
Wedel Stephen
Purchase Details
Closed on
Nov 17, 2005
Sold by
Wedel Stephen M
Bought by
Wedel Stephen M and Wedel Melissa
Create a Home Valuation Report for This Property
The Home Valuation Report is an in-depth analysis detailing your home's value as well as a comparison with similar homes in the area
Home Values in the Area
Average Home Value in this Area
Purchase History
| Date | Buyer | Sale Price | Title Company |
|---|---|---|---|
| Marquez Michael | $190,000 | Servicelink | |
| Heuer Justin | -- | -- | |
| Heuer Justin | $190,000 | -- | |
| Wedel Stephen | -- | -- | |
| Wedel Stephen M | -- | -- |
Source: Public Records
Mortgage History
| Date | Status | Borrower | Loan Amount |
|---|---|---|---|
| Previous Owner | Marquez Michael | $180,500 | |
| Previous Owner | Heuer Justin | $151,920 |
Source: Public Records
Tax History Compared to Growth
Tax History
| Year | Tax Paid | Tax Assessment Tax Assessment Total Assessment is a certain percentage of the fair market value that is determined by local assessors to be the total taxable value of land and additions on the property. | Land | Improvement |
|---|---|---|---|---|
| 2024 | $5,756 | $76,858 | $11,253 | $65,605 |
| 2023 | $5,756 | $67,014 | $9,812 | $57,202 |
| 2022 | $5,590 | $61,183 | $11,198 | $49,985 |
| 2021 | $6,364 | $57,384 | $10,503 | $46,881 |
| 2020 | $6,508 | $56,470 | $10,336 | $46,134 |
| 2019 | $6,381 | $54,251 | $9,930 | $44,321 |
| 2018 | $6,231 | $52,411 | $9,593 | $42,818 |
| 2017 | $6,290 | $50,380 | $9,221 | $41,159 |
| 2016 | $6,221 | $49,108 | $8,988 | $40,120 |
| 2015 | -- | $46,530 | $8,516 | $38,014 |
| 2014 | -- | $42,797 | $12,323 | $30,474 |
| 2013 | -- | $44,955 | $12,944 | $32,011 |
Source: Public Records
Map
Nearby Homes
- 451 Thresher St
- 476 Thresher St
- 1663 Furrow St
- 1692 Furrow St
- 1723 Goldenrod Turn
- 1734 Sunglow Ln
- 399 Bantam St
- 910 Dawn Ct
- 1177 Golf Ct
- 1169 Golf Ct
- 430 Turnbury Ct E
- 1205 S 1st St
- 100 Warren Place
- 612 Russell Rd
- 528 College Ave
- Lot 4 N Annie Glidden Rd
- 110 Pooler Ave
- 356 Augusta Ave
- 720 S 2nd St
- 345 Augusta Ave
- 553 Jasmine St
- 539 Jasmine St
- 464 Horizon Ln
- 452 Horizon Ln
- 561 Magnolia St
- 486 Horizon Ln
- 540 Jasmine St
- 527 Jasmine St
- 446 Horizon Ln
- 492 Horizon Ln
- 548 Jasmine St
- 577 Magnolia St
- 430 Horizon Ln
- 526 Jasmine St
- 504 Horizon Ln
- 560 Jasmine St
- 515 Jasmine St
- 571 Jasmine St
- 1420 Schade Ln
- 422 Horizon Ln