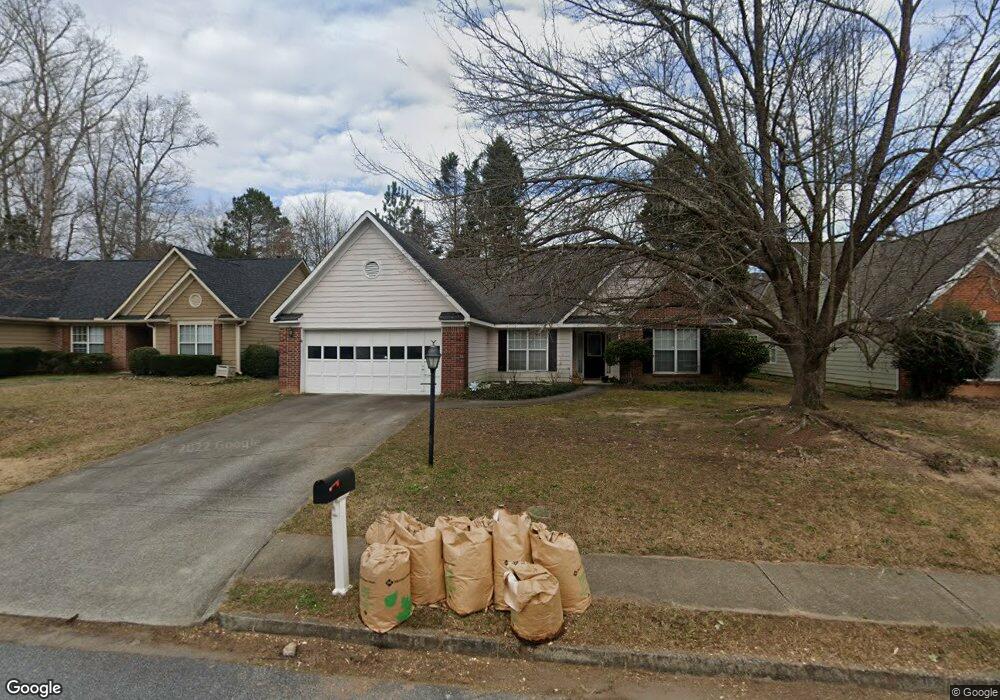
545 Lendl Ln Lawrenceville, GA 30044
Gwinnett Place NeighborhoodEstimated Value: $355,316 - $371,000
3
Beds
2
Baths
1,750
Sq Ft
$206/Sq Ft
Est. Value
About This Home
This home is located at 545 Lendl Ln, Lawrenceville, GA 30044 and is currently estimated at $360,079, approximately $205 per square foot. 545 Lendl Ln is a home located in Gwinnett County with nearby schools including Benefield Elementary School, Richards Middle School, and Discovery High School.
Ownership History
Date
Name
Owned For
Owner Type
Purchase Details
Closed on
Oct 21, 2009
Sold by
Dotson Patricia G
Bought by
Abel Velma
Current Estimated Value
Home Financials for this Owner
Home Financials are based on the most recent Mortgage that was taken out on this home.
Original Mortgage
$132,554
Outstanding Balance
$86,246
Interest Rate
5.01%
Mortgage Type
FHA
Estimated Equity
$273,833
Purchase Details
Closed on
Mar 23, 2001
Sold by
Kieser Dwight and Kieser Kathryn
Bought by
Dotson Patricia G
Home Financials for this Owner
Home Financials are based on the most recent Mortgage that was taken out on this home.
Original Mortgage
$108,000
Interest Rate
7.02%
Mortgage Type
New Conventional
Purchase Details
Closed on
Oct 28, 1994
Sold by
Stratford Bldrs Inc
Bought by
Kieser Dwight Kathryn
Home Financials for this Owner
Home Financials are based on the most recent Mortgage that was taken out on this home.
Original Mortgage
$99,900
Interest Rate
8.68%
Create a Home Valuation Report for This Property
The Home Valuation Report is an in-depth analysis detailing your home's value as well as a comparison with similar homes in the area
Home Values in the Area
Average Home Value in this Area
Purchase History
| Date | Buyer | Sale Price | Title Company |
|---|---|---|---|
| Abel Velma | $135,000 | -- | |
| Dotson Patricia G | $144,000 | -- | |
| Kieser Dwight Kathryn | $111,000 | -- |
Source: Public Records
Mortgage History
| Date | Status | Borrower | Loan Amount |
|---|---|---|---|
| Open | Abel Velma | $132,554 | |
| Previous Owner | Dotson Patricia G | $108,000 | |
| Previous Owner | Kieser Dwight Kathryn | $99,900 |
Source: Public Records
Tax History Compared to Growth
Tax History
| Year | Tax Paid | Tax Assessment Tax Assessment Total Assessment is a certain percentage of the fair market value that is determined by local assessors to be the total taxable value of land and additions on the property. | Land | Improvement |
|---|---|---|---|---|
| 2024 | $4,902 | $128,720 | $21,600 | $107,120 |
| 2023 | $4,902 | $126,000 | $28,400 | $97,600 |
| 2022 | $3,104 | $109,080 | $24,000 | $85,080 |
| 2021 | $2,678 | $86,400 | $18,800 | $67,600 |
| 2020 | $2,592 | $81,560 | $16,800 | $64,760 |
| 2019 | $2,424 | $76,560 | $16,800 | $59,760 |
| 2018 | $2,252 | $68,680 | $14,800 | $53,880 |
| 2016 | $2,007 | $56,360 | $12,000 | $44,360 |
| 2015 | $1,598 | $42,480 | $8,800 | $33,680 |
| 2014 | $1,605 | $42,480 | $8,800 | $33,680 |
Source: Public Records
Map
Nearby Homes
- 1788 Arbor Gate Dr Unit 1505
- 1847 Oak Ridge Ln Unit 4
- 776 Tulip Poplar Way
- 644 Garden Grove Dr
- 801 Tulip Poplar Way Unit 2501
- 818 Arbor Gate Ln Unit 818
- 803 Arbor Gate Ln Unit 803
- 1980 Champions Pkwy
- 904 Steffi Ct Unit 3
- 1880 Garbrooke Cove
- 1789 Riverlanding Cir
- 1870 Garbrooke Cove
- 2014 Poplar Ridge
- 2035 Northland Dr
- 1684 Oak Ridge Way
- 581 Black Creek Dr
- 1759 Coleville Oak Ln
- 2023 S Oak Dr Unit 5
- 1851 Stoney Chase Dr
- 555 Lendl Ln
- 525 Lendl Ln
- 1260 Lendl Ln
- 1250 Lendl Ln
- 565 Lendl Ln Unit 2
- 1270 Lendl Ln
- 540 Lendl Ln Unit 2
- 530 Lendl Ln
- 1240 Lendl Ln
- 550 Lendl Ln
- 575 Lendl Ln
- 520 Lendl Ln
- 570 Lendl Ln
- 1275 Lendl Ln
- 1230 Lendl Ln Unit 6
- 500 Lendl Ln Unit II
- 1844 Lendl Ct
- 505 Lendl Ln
- 1255 Lendl Ln Unit 6
- 585 Lendl Ln