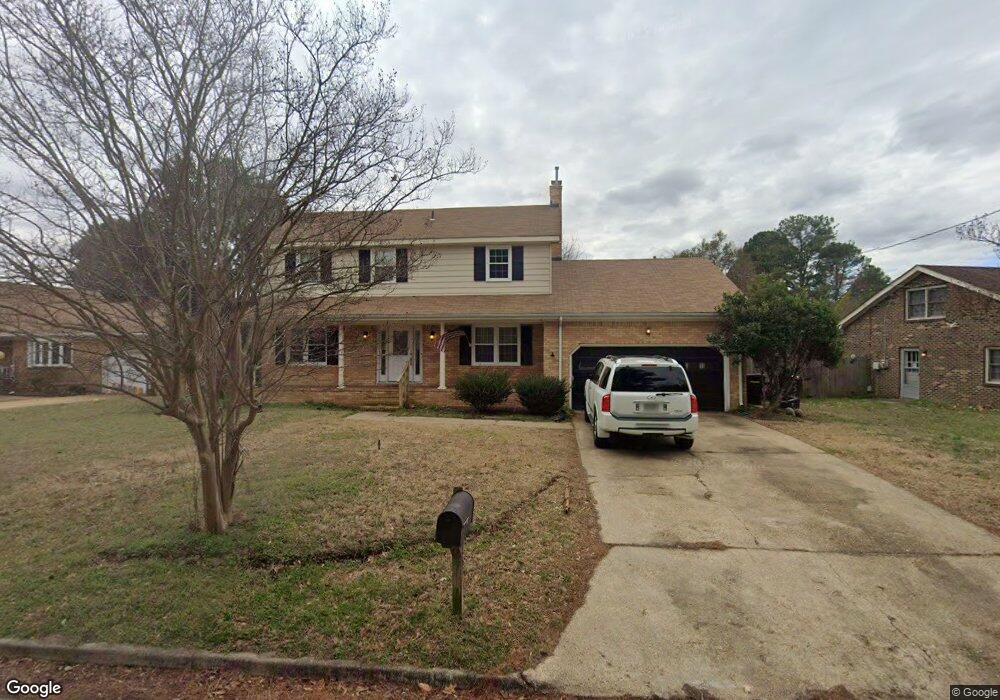
545 Longdale Crescent Chesapeake, VA 23325
Indian River NeighborhoodEstimated Value: $419,000 - $444,000
5
Beds
3
Baths
2,800
Sq Ft
$153/Sq Ft
Est. Value
About This Home
This home is located at 545 Longdale Crescent, Chesapeake, VA 23325 and is currently estimated at $429,075, approximately $153 per square foot. 545 Longdale Crescent is a home located in Chesapeake City with nearby schools including Georgetown Primary School, Sparrow Road Intermediate School, and Indian River Middle.
Ownership History
Date
Name
Owned For
Owner Type
Purchase Details
Closed on
Feb 15, 2023
Sold by
Smith Kayla
Bought by
Godbolt Anthony J
Current Estimated Value
Home Financials for this Owner
Home Financials are based on the most recent Mortgage that was taken out on this home.
Original Mortgage
$404,040
Outstanding Balance
$391,363
Interest Rate
6.33%
Mortgage Type
VA
Estimated Equity
$37,712
Purchase Details
Closed on
Mar 28, 2013
Sold by
Provan Edwin A
Bought by
Smith Johnny L
Home Financials for this Owner
Home Financials are based on the most recent Mortgage that was taken out on this home.
Original Mortgage
$224,627
Interest Rate
3.56%
Mortgage Type
VA
Purchase Details
Closed on
Nov 30, 1998
Sold by
Morello Michael J
Bought by
Profvan Edwin A
Home Financials for this Owner
Home Financials are based on the most recent Mortgage that was taken out on this home.
Original Mortgage
$147,805
Interest Rate
6.68%
Mortgage Type
VA
Create a Home Valuation Report for This Property
The Home Valuation Report is an in-depth analysis detailing your home's value as well as a comparison with similar homes in the area
Home Values in the Area
Average Home Value in this Area
Purchase History
| Date | Buyer | Sale Price | Title Company |
|---|---|---|---|
| Godbolt Anthony J | $390,000 | Fidelity National Title | |
| Godbolt Anthony J | $390,000 | Fidelity National Title | |
| Smith Johnny L | $219,900 | -- | |
| Profvan Edwin A | $143,500 | -- |
Source: Public Records
Mortgage History
| Date | Status | Borrower | Loan Amount |
|---|---|---|---|
| Open | Godbolt Anthony J | $404,040 | |
| Closed | Godbolt Anthony J | $404,040 | |
| Previous Owner | Smith Johnny L | $224,627 | |
| Previous Owner | Profvan Edwin A | $147,805 |
Source: Public Records
Tax History Compared to Growth
Tax History
| Year | Tax Paid | Tax Assessment Tax Assessment Total Assessment is a certain percentage of the fair market value that is determined by local assessors to be the total taxable value of land and additions on the property. | Land | Improvement |
|---|---|---|---|---|
| 2025 | $3,717 | $371,600 | $125,000 | $246,600 |
| 2024 | $3,717 | $368,000 | $115,000 | $253,000 |
| 2023 | $3,438 | $362,700 | $105,000 | $257,700 |
| 2022 | $3,457 | $342,300 | $95,000 | $247,300 |
| 2021 | $3,173 | $302,200 | $75,000 | $227,200 |
| 2020 | $3,043 | $289,800 | $75,000 | $214,800 |
| 2019 | $2,900 | $276,200 | $75,000 | $201,200 |
| 2018 | $2,746 | $261,500 | $75,000 | $186,500 |
| 2017 | $2,633 | $250,800 | $75,000 | $175,800 |
| 2016 | $2,633 | $250,800 | $75,000 | $175,800 |
| 2015 | $2,633 | $250,800 | $75,000 | $175,800 |
| 2014 | $2,633 | $250,800 | $75,000 | $175,800 |
Source: Public Records
Map
Nearby Homes
- 1998 Angora Dr
- 517 Dent Place
- 1523 Oleander Ave
- 2453 Old Greenbrier Rd Unit 124
- Lot Angora Dr
- 2301 Old Greenbrier Rd
- 1427 Myrtle Ave
- 1425 Myrtle Ave
- 2916 Doris Ave
- 2924 Candlewood Cir
- 2320 Dunbarton Ct
- 2308 Dunbarton Dr
- 1410 Myrtle Ave
- 2820 Candlewood Cir
- 746 Milby Dr
- 2111 Stalham Rd
- 1400 Hazel Ave
- 1503 Linden Ave
- 708 Stalham Rd
- 837 Providence Rd
- 549 Longdale Crescent
- 541 Longdale Crescent
- 521 Whitehaven Ct
- 516 Whitehaven Ct
- 537 Longdale Crescent
- 544 Longdale Crescent
- 553 Longdale Crescent
- 540 Longdale Crescent
- 548 Longdale Crescent
- 541 Crown Crescent
- 536 Longdale Crescent
- 517 Whitehaven Ct
- 512 Whitehaven Ct
- 565 Longdale Crescent
- 537 Crown Crescent
- 513 Whitehaven Ct
- 553 Crown Crescent
- 508 Whitehaven Ct
- 556 Longdale Crescent
- 540 Crown Crescent