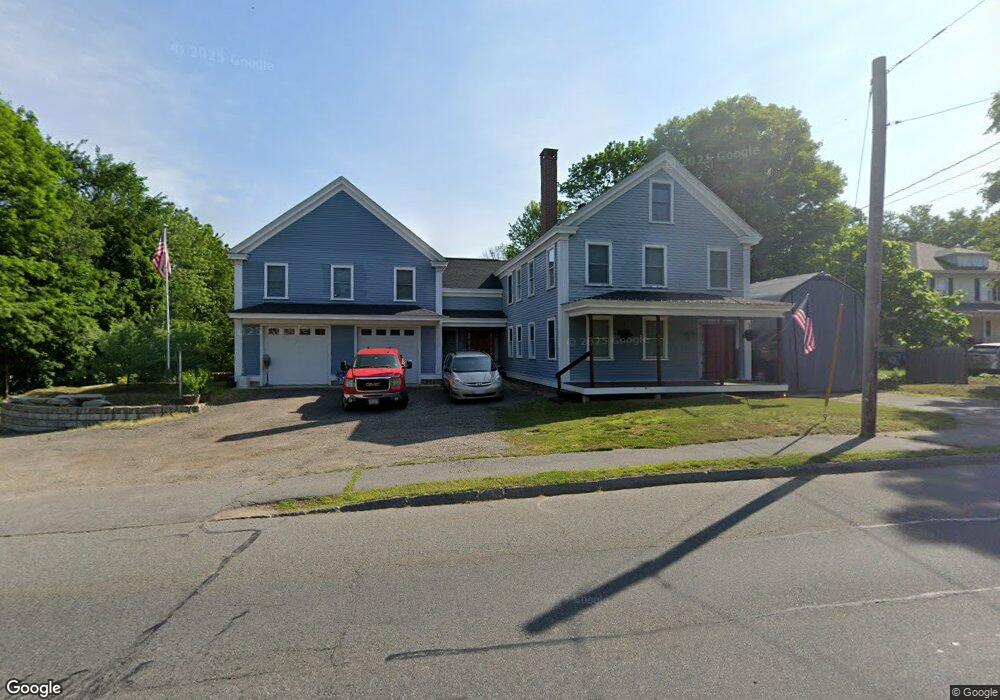
545 Main St Bridgewater, MA 02324
Estimated Value: $604,000 - $973,000
3
Beds
3
Baths
2,000
Sq Ft
$396/Sq Ft
Est. Value
About This Home
This home is located at 545 Main St, Bridgewater, MA 02324 and is currently estimated at $792,360, approximately $396 per square foot. 545 Main St is a home located in Plymouth County with nearby schools including Mitchell Elementary School, Williams Intermediate School, and Bridgewater Middle School.
Ownership History
Date
Name
Owned For
Owner Type
Purchase Details
Closed on
Mar 5, 2003
Sold by
Allen Scott E and Allen Kathleen M
Bought by
Allen Scott E and Allen Kathleen M
Current Estimated Value
Purchase Details
Closed on
Dec 15, 2000
Sold by
Kent Dennis C and Robinson Mary E
Bought by
Santangelo Kathleen M and Allen Scott E
Create a Home Valuation Report for This Property
The Home Valuation Report is an in-depth analysis detailing your home's value as well as a comparison with similar homes in the area
Home Values in the Area
Average Home Value in this Area
Purchase History
| Date | Buyer | Sale Price | Title Company |
|---|---|---|---|
| Allen Scott E | -- | -- | |
| Allen Scott E | -- | -- | |
| Santangelo Kathleen M | $185,000 | -- | |
| Santangelo Kathleen M | $185,000 | -- |
Source: Public Records
Mortgage History
| Date | Status | Borrower | Loan Amount |
|---|---|---|---|
| Open | Santangelo Kathleen M | $103,300 | |
| Open | Santangelo Kathleen M | $188,000 |
Source: Public Records
Tax History
| Year | Tax Paid | Tax Assessment Tax Assessment Total Assessment is a certain percentage of the fair market value that is determined by local assessors to be the total taxable value of land and additions on the property. | Land | Improvement |
|---|---|---|---|---|
| 2025 | $9,817 | $829,800 | $183,000 | $646,800 |
| 2024 | $9,149 | $753,600 | $164,800 | $588,800 |
| 2023 | $9,050 | $704,800 | $154,000 | $550,800 |
| 2022 | $8,105 | $566,000 | $135,200 | $430,800 |
| 2021 | $6,897 | $476,300 | $120,700 | $355,600 |
| 2020 | $6,586 | $447,100 | $116,000 | $331,100 |
| 2019 | $6,037 | $407,100 | $116,000 | $291,100 |
| 2018 | $4,495 | $359,300 | $125,500 | $233,800 |
| 2017 | $5,222 | $334,500 | $125,500 | $209,000 |
| 2016 | $5,013 | $322,600 | $123,100 | $199,500 |
| 2015 | $4,807 | $296,000 | $113,300 | $182,700 |
| 2014 | $4,717 | $290,300 | $110,000 | $180,300 |
Source: Public Records
Map
Nearby Homes
- 48 Wall St
- 18 Aldrich Rd
- 120 Mary Ln Unit 3
- 30 Oak Meadow Place Unit 30
- 10 Oak Meadow Place Unit 10
- 30 Keenan St
- 5 Heather Ln
- 180 Main St Unit 6109
- 180 Main St Unit 4105
- 57 Stetson St
- 54 Michael Rd Unit 33
- 580 Broad St Unit 2
- 580 Broad St Unit 1
- 47 Hale St
- 0 Bedford St Unit 73480500
- Lot 2 Fontana Way
- 118 Plesant St
- 167 Spring St
- 6 Andrea Way
- 108 Bryant St
Your Personal Tour Guide
Ask me questions while you tour the home.