545 Main St E Savannah, TN 38372
Estimated Value: $95,000 - $130,000
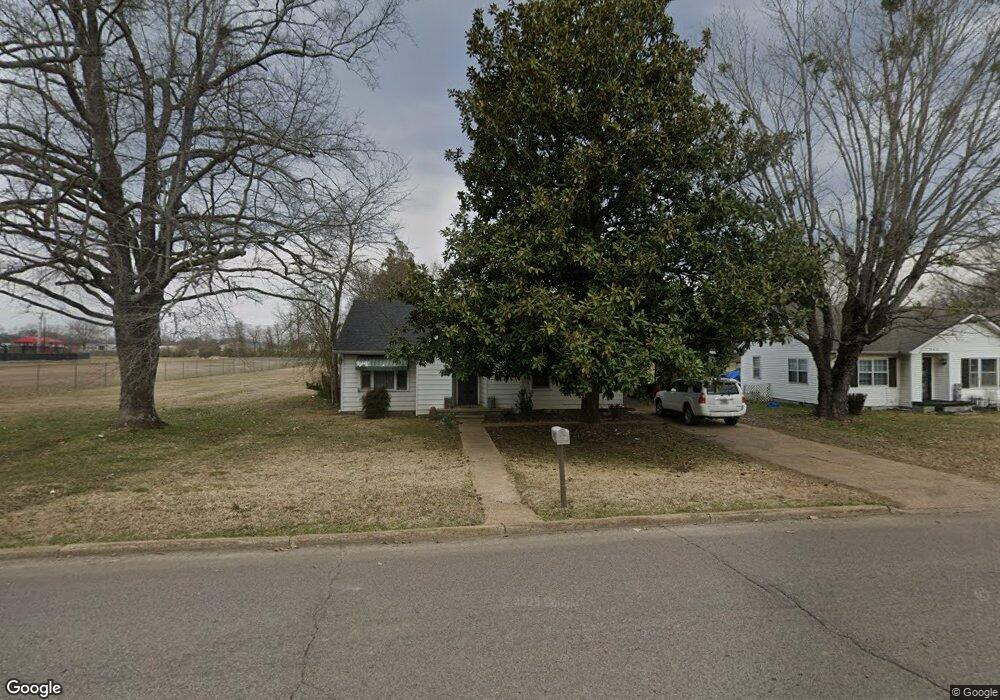
About This Home
This home is located at 545 Main St E, Savannah, TN 38372 and is currently estimated at $107,000, approximately $99 per square foot. 545 Main St E is a home located in Hardin County with nearby schools including Hardin County High School, Hardin County Christian School, and Savannah Christian Academy.
Ownership History
We collect this data history from publicly available records. To have your information removed, we recommend requesting removal directly through your county’s website.
Purchase Details
Purchase Details
Purchase Details
Purchase Details
Home Financials for this Owner
Home Financials are based on the most recent Mortgage that was taken out on this home.Purchase Details
Purchase Details
Purchase Details
Purchase Details
Home Values in the Area
Average Home Value in this Area
Purchase History
We collect this data history from publicly available records. To have your information removed, we recommend requesting removal directly through your county’s website.
| Date | Buyer | Sale Price | Title Company |
|---|---|---|---|
| -- | None Listed On Document | ||
| $163,000 | -- | ||
| -- | -- | ||
| $40,000 | -- | ||
| -- | -- | ||
| $30,000 | -- | ||
| -- | -- | ||
| -- | -- |
Mortgage History
We collect this data history from publicly available records. To have your information removed, we recommend requesting removal directly through your county’s website.
| Date | Status | Borrower | Loan Amount |
|---|---|---|---|
| Previous Owner | $46,139 |
Tax History
We collect this data history from publicly available records. To have your information removed, we recommend requesting removal directly through your county’s website.
| Year | Tax Paid | Tax Assessment Tax Assessment Total Assessment is a certain percentage of the fair market value that is determined by local assessors to be the total taxable value of land and additions on the property. | Land | Improvement |
|---|---|---|---|---|
| 2025 | $623 | $25,400 | $2,750 | $22,650 |
| 2024 | $623 | $25,400 | $2,750 | $22,650 |
| 2023 | $623 | $25,400 | $2,750 | $22,650 |
| 2022 | $348 | $12,600 | $2,675 | $9,925 |
| 2021 | $348 | $12,600 | $2,675 | $9,925 |
| 2020 | $348 | $12,600 | $2,675 | $9,925 |
| 2019 | $348 | $12,600 | $2,675 | $9,925 |
| 2018 | $339 | $12,600 | $2,675 | $9,925 |
| 2017 | $279 | $10,050 | $2,150 | $7,900 |
| 2016 | $279 | $10,050 | $2,150 | $7,900 |
| 2015 | $253 | $10,050 | $2,150 | $7,900 |
| 2014 | $253 | $10,050 | $2,150 | $7,900 |
Map
- 315 Belmont St
- 710 Main St E
- 00 Enoch Blvd
- 20 Daniel St
- 85 Fairground St
- 120 Cochran St
- 13305 U S Highway 64
- 50 Perry Place
- 171 White St
- 175 Florence Rd
- 60 White St
- 7 High Pointe Dr
- 0 High Pointe Dr Unit 10202679
- 145 Rb Dr
- 110 Rb Dr
- 35 Robertson St
- 135 Cumberland St
- 235 Parkview Dr
- 145 Cumberland St
- 90 Shaw Ln
- 35 Turner Kyle Dr
- 45 Turner Kyle Dr
- 580 Main St E
- 410 Belmont St
- 600 Main St E
- 55 Turner Kyle Dr
- 610 Main St E
- 30 Turner Kyle Dr
- 40 Turner Kyle Dr
- 430 Belmont St
- 550 Main St E
- 585 Main St E
- 565 Main St E
- 75 Turner Kyle Dr
- 60 Turner Kyle Dr
- 630 Main St E
- 435 Belmont St
- 190 Long St
- 95 Turner Kyle Dr
- 440 Belmont St
Ask me questions while you tour the home.