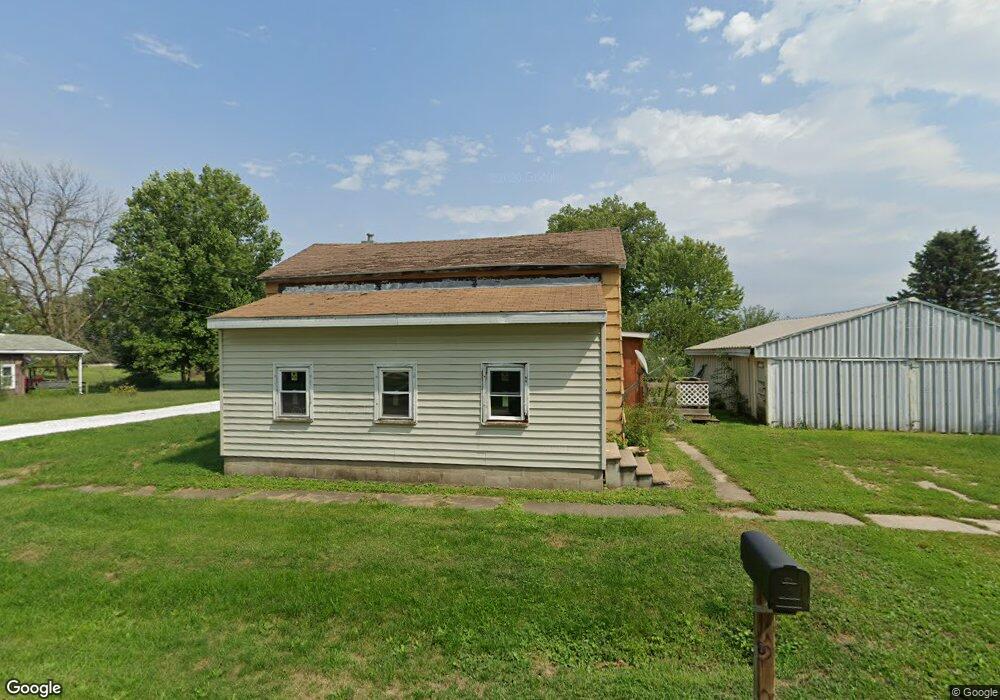
545 N Cadwalader St Prairie City, IL 61470
Estimated Value: $50,632 - $67,000
3
Beds
--
Bath
1,067
Sq Ft
$51/Sq Ft
Est. Value
About This Home
This home is located at 545 N Cadwalader St, Prairie City, IL 61470 and is currently estimated at $54,908, approximately $51 per square foot. 545 N Cadwalader St is a home located in McDonough County with nearby schools including Bushnell-Prairie City Elementary School, Bushnell-Prairie City Junior High School, and Bushnell-Prairie City High School.
Ownership History
Date
Name
Owned For
Owner Type
Purchase Details
Closed on
Sep 11, 2020
Sold by
Raritan State Bank
Bought by
Waller Leland R
Current Estimated Value
Purchase Details
Closed on
Oct 21, 2019
Sold by
Johnson Tammie
Bought by
Raritan State Bank
Purchase Details
Closed on
May 13, 2016
Sold by
Sinnett Nancy
Bought by
Johnson Tammie F
Home Financials for this Owner
Home Financials are based on the most recent Mortgage that was taken out on this home.
Original Mortgage
$18,000
Interest Rate
4.57%
Mortgage Type
Future Advance Clause Open End Mortgage
Purchase Details
Closed on
Nov 10, 2015
Sold by
Mcfetridge Vernon E and Mcfetridge Harry R
Bought by
Sinnett Nancy
Purchase Details
Closed on
Feb 18, 2011
Sold by
Mcfetridge Harry R and Mcfetridge Mary E
Bought by
Sloan Debra and Mcfetridge Roger Lee
Create a Home Valuation Report for This Property
The Home Valuation Report is an in-depth analysis detailing your home's value as well as a comparison with similar homes in the area
Home Values in the Area
Average Home Value in this Area
Purchase History
| Date | Buyer | Sale Price | Title Company |
|---|---|---|---|
| Waller Leland R | $5,000 | Attorney | |
| Raritan State Bank | -- | None Available | |
| Johnson Tammie F | $18,000 | Attorney | |
| Sinnett Nancy | -- | None Available | |
| Sloan Debra | -- | None Available |
Source: Public Records
Mortgage History
| Date | Status | Borrower | Loan Amount |
|---|---|---|---|
| Previous Owner | Johnson Tammie F | $18,000 |
Source: Public Records
Tax History Compared to Growth
Tax History
| Year | Tax Paid | Tax Assessment Tax Assessment Total Assessment is a certain percentage of the fair market value that is determined by local assessors to be the total taxable value of land and additions on the property. | Land | Improvement |
|---|---|---|---|---|
| 2024 | $805 | $8,935 | $1,922 | $7,013 |
| 2023 | $778 | $8,861 | $1,906 | $6,955 |
| 2022 | $712 | $8,086 | $1,739 | $6,347 |
| 2021 | $687 | $7,733 | $1,663 | $6,070 |
| 2020 | $704 | $9,396 | $1,663 | $7,733 |
| 2019 | $190 | $8,071 | $1,736 | $6,335 |
| 2018 | $194 | $8,248 | $1,774 | $6,474 |
| 2017 | $203 | $8,203 | $1,764 | $6,439 |
| 2016 | $720 | $7,667 | $1,649 | $6,018 |
| 2015 | -- | $7,667 | $1,649 | $6,018 |
| 2014 | -- | $7,667 | $1,649 | $6,018 |
| 2013 | -- | $8,418 | $1,811 | $6,607 |
Source: Public Records
Map
Nearby Homes
- 235 N Smith St
- 300 S Park St
- 306 S Main St
- 307 W Lafayette St
- 208 S Main St
- 301 E Cortland St
- 305 E Washington St
- 315 E Washington St
- 403 E Woods St
- 108 E Grant St
- 88 Oak Ln
- 45 Bricker Cir
- 21 Bricker Cir
- 140 Palemino Dr
- 4 Hiel Dr
- 295 W Harris Ave
- 1024 W Main St
- 994 N Crafford St
- 924 N Crafford St
- 134 W Osborne St
- 530 N Cadwalader St
- 505 N Cadwalader St
- 605 N Cadwalader St
- 540 N Nassau St
- 790 E Scott St
- 600 N Cadwalader St
- 445 N Cadwalader St
- 440 N Cadwalader St
- 630 N Cadwalader St
- 604 E Nassau St
- 635 N Cadwalader St
- 430 N Cadwalader St
- 420 N Nassau St
- 605 N Nassau St
- 700 E Franklin St
- 425 N Reed St
- 600 E Franklin St
- 430 N Reed St
- 645 N Nassau St
- 314 N Nassau St