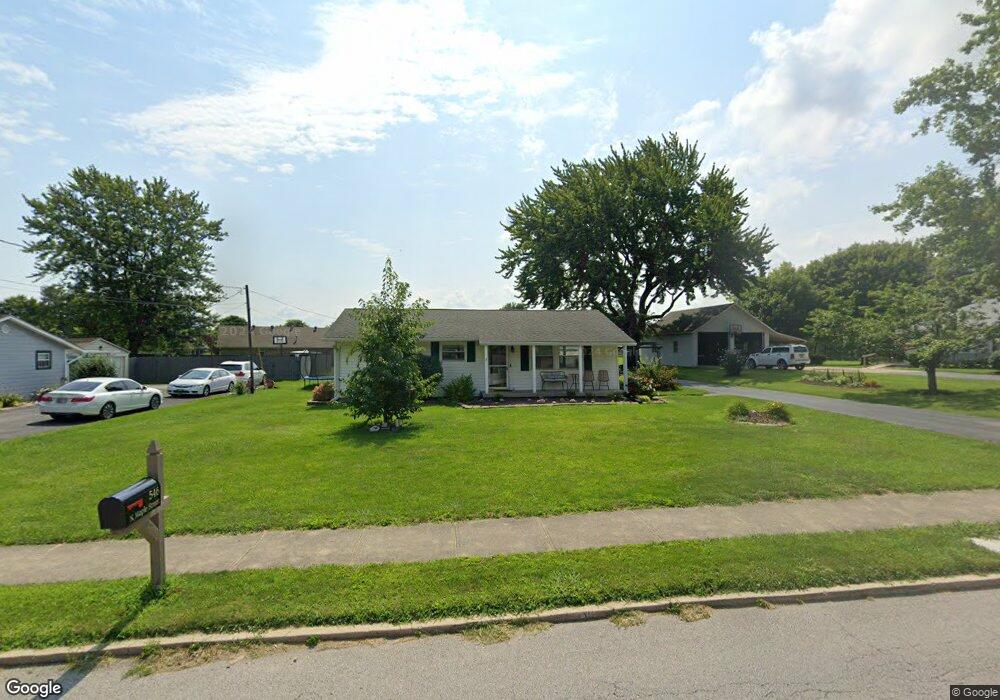
545 N Maple St Pittsboro, IN 46167
Estimated Value: $210,000 - $241,197
3
Beds
1
Bath
1,240
Sq Ft
$179/Sq Ft
Est. Value
About This Home
This home is located at 545 N Maple St, Pittsboro, IN 46167 and is currently estimated at $221,799, approximately $178 per square foot. 545 N Maple St is a home located in Hendricks County with nearby schools including Pittsboro Primary School, Pittsboro Elementary School, and Tri-West Middle School.
Ownership History
Date
Name
Owned For
Owner Type
Purchase Details
Closed on
Jun 3, 2020
Sold by
Ping Steven G and Ping Shari L
Bought by
Miller Richard and Miller Rhonda
Current Estimated Value
Home Financials for this Owner
Home Financials are based on the most recent Mortgage that was taken out on this home.
Original Mortgage
$112,500
Outstanding Balance
$99,723
Interest Rate
3.2%
Mortgage Type
New Conventional
Estimated Equity
$122,076
Purchase Details
Closed on
May 21, 2015
Sold by
Ping Joyce
Bought by
Ping L
Create a Home Valuation Report for This Property
The Home Valuation Report is an in-depth analysis detailing your home's value as well as a comparison with similar homes in the area
Home Values in the Area
Average Home Value in this Area
Purchase History
| Date | Buyer | Sale Price | Title Company |
|---|---|---|---|
| Miller Richard | $150,000 | None Available | |
| Ping L | $75,000 | -- | |
| Ping Steven G | -- | -- |
Source: Public Records
Mortgage History
| Date | Status | Borrower | Loan Amount |
|---|---|---|---|
| Open | Miller Richard | $112,500 |
Source: Public Records
Tax History Compared to Growth
Tax History
| Year | Tax Paid | Tax Assessment Tax Assessment Total Assessment is a certain percentage of the fair market value that is determined by local assessors to be the total taxable value of land and additions on the property. | Land | Improvement |
|---|---|---|---|---|
| 2024 | $1,876 | $177,600 | $27,000 | $150,600 |
| 2023 | $1,944 | $170,700 | $25,900 | $144,800 |
| 2022 | $1,784 | $149,600 | $27,500 | $122,100 |
| 2021 | $1,635 | $138,600 | $27,500 | $111,100 |
| 2020 | $1,499 | $129,700 | $27,500 | $102,200 |
| 2019 | $1,338 | $116,900 | $18,400 | $98,500 |
| 2018 | $1,095 | $106,900 | $18,400 | $88,500 |
| 2017 | $912 | $100,900 | $17,500 | $83,400 |
| 2016 | $956 | $97,500 | $17,500 | $80,000 |
| 2014 | $1,933 | $95,200 | $17,000 | $78,200 |
Source: Public Records
Map
Nearby Homes
- 771 Penny Ln
- 474 Weaver Ln
- Exclusives 3630 Plan at Hidden Hills - Exclusives Series
- Exclusives 3360 Plan at Hidden Hills - Exclusives Series
- Exclusives 3074 Plan at Hidden Hills - Exclusives Series
- Exclusives 2467 Plan at Hidden Hills - Exclusives Series
- Exclusives 2120 Plan at Hidden Hills - Exclusives Series
- Exclusives 2542 Plan at Hidden Hills - Exclusives Series
- Legacy 3536 Plan at Hidden Hills - Legacy Series
- Legacy 3040 Plan at Hidden Hills - Legacy Series
- Legacy 2719 Plan at Hidden Hills - Legacy Series
- Legacy 2146 Plan at Hidden Hills - Legacy Series
- Legacy 2634 Plan at Hidden Hills - Legacy Series
- Legacy 1843 Plan at Hidden Hills - Legacy Series
- Legacy 2432 Plan at Hidden Hills - Legacy Series
- Legacy 2307 Plan at Hidden Hills - Legacy Series
- Exclusives 2867 Plan at Hidden Hills - Exclusives Series
- Legacy 1942 Plan at Hidden Hills - Legacy Series
- Legacy 1572 Plan at Hidden Hills - Legacy Series
- Exclusives 2665 Plan at Hidden Hills - Exclusives Series