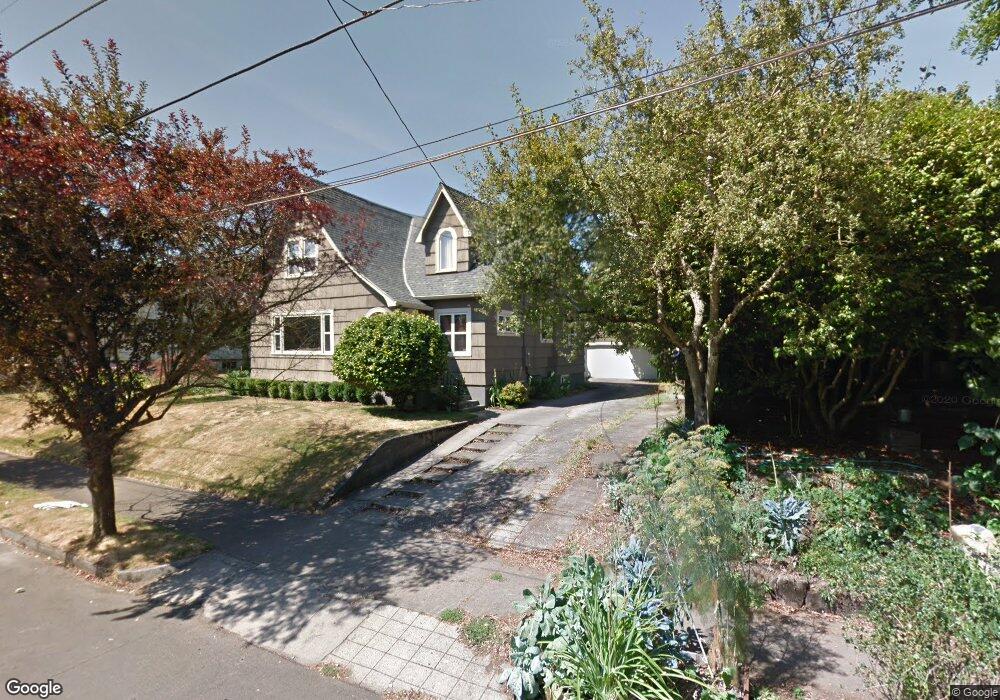
545 NE Cook St Portland, OR 97212
Estimated Value: $740,000 - $901,000
3
Beds
3
Baths
1,973
Sq Ft
$425/Sq Ft
Est. Value
About This Home
This home is located at 545 NE Cook St, Portland, OR 97212 and is currently estimated at $837,620, approximately $424 per square foot. 545 NE Cook St is a home located in Multnomah County with nearby schools including Boise-Eliot Elementary School, Harriet Tubman Middle School, and Jefferson High School.
Ownership History
Date
Name
Owned For
Owner Type
Purchase Details
Closed on
Mar 29, 2012
Sold by
Schram Mitchell W
Bought by
Schram Mitchell W and Mueller Curtis A
Current Estimated Value
Home Financials for this Owner
Home Financials are based on the most recent Mortgage that was taken out on this home.
Original Mortgage
$416,000
Outstanding Balance
$287,336
Interest Rate
3.91%
Mortgage Type
New Conventional
Estimated Equity
$550,284
Purchase Details
Closed on
Nov 30, 1998
Sold by
Manning Dewayne Lee
Bought by
Schram Mitchell W
Home Financials for this Owner
Home Financials are based on the most recent Mortgage that was taken out on this home.
Original Mortgage
$134,867
Interest Rate
6.69%
Mortgage Type
FHA
Purchase Details
Closed on
Nov 28, 1998
Sold by
Manning Sonya
Bought by
Manning Dewayne Lee
Home Financials for this Owner
Home Financials are based on the most recent Mortgage that was taken out on this home.
Original Mortgage
$134,867
Interest Rate
6.69%
Mortgage Type
FHA
Purchase Details
Closed on
Nov 27, 1998
Sold by
Manning Andrena
Bought by
Manning Dewayne Lee
Home Financials for this Owner
Home Financials are based on the most recent Mortgage that was taken out on this home.
Original Mortgage
$134,867
Interest Rate
6.69%
Mortgage Type
FHA
Purchase Details
Closed on
Nov 25, 1998
Sold by
Manning Eugene
Bought by
Manning Dewayne Lee
Home Financials for this Owner
Home Financials are based on the most recent Mortgage that was taken out on this home.
Original Mortgage
$134,867
Interest Rate
6.69%
Mortgage Type
FHA
Purchase Details
Closed on
Nov 20, 1998
Sold by
Williams Sheree
Bought by
Manning Dewayne Lee
Home Financials for this Owner
Home Financials are based on the most recent Mortgage that was taken out on this home.
Original Mortgage
$134,867
Interest Rate
6.69%
Mortgage Type
FHA
Purchase Details
Closed on
Nov 4, 1998
Sold by
Manning Rickie
Bought by
Manning Dewayne Lee
Home Financials for this Owner
Home Financials are based on the most recent Mortgage that was taken out on this home.
Original Mortgage
$134,867
Interest Rate
6.69%
Mortgage Type
FHA
Purchase Details
Closed on
Apr 13, 1995
Sold by
Manning Olive Byrd
Bought by
Manning Dewayne Lee
Create a Home Valuation Report for This Property
The Home Valuation Report is an in-depth analysis detailing your home's value as well as a comparison with similar homes in the area
Home Values in the Area
Average Home Value in this Area
Purchase History
| Date | Buyer | Sale Price | Title Company |
|---|---|---|---|
| Schram Mitchell W | -- | First American | |
| Schram Mitchell W | $136,000 | Oregon Title Insurance Co | |
| Manning Dewayne Lee | -- | Oregon Title Insurance Co | |
| Manning Dewayne Lee | -- | Oregon Title Insurance Co | |
| Manning Dewayne Lee | -- | Oregon Title Insurance Co | |
| Manning Dewayne Lee | -- | Oregon Title Insurance Co | |
| Manning Dewayne Lee | -- | Oregon Title Insurance Co | |
| Manning Dewayne Lee | -- | Oregon Title Insurance Co | |
| Manning Dewayne Lee | -- | -- |
Source: Public Records
Mortgage History
| Date | Status | Borrower | Loan Amount |
|---|---|---|---|
| Open | Schram Mitchell W | $416,000 | |
| Closed | Schram Mitchell W | $134,867 |
Source: Public Records
Tax History Compared to Growth
Tax History
| Year | Tax Paid | Tax Assessment Tax Assessment Total Assessment is a certain percentage of the fair market value that is determined by local assessors to be the total taxable value of land and additions on the property. | Land | Improvement |
|---|---|---|---|---|
| 2024 | $5,739 | $214,500 | -- | -- |
| 2023 | $5,519 | $208,260 | $0 | $0 |
| 2022 | $5,399 | $202,200 | $0 | $0 |
| 2021 | $5,308 | $196,320 | $0 | $0 |
| 2020 | $4,870 | $190,610 | $0 | $0 |
| 2019 | $4,691 | $185,060 | $0 | $0 |
| 2018 | $4,553 | $179,670 | $0 | $0 |
| 2017 | $4,363 | $174,440 | $0 | $0 |
| 2016 | $3,993 | $169,360 | $0 | $0 |
| 2015 | $3,888 | $164,430 | $0 | $0 |
| 2014 | $3,830 | $159,650 | $0 | $0 |
Source: Public Records
Map
Nearby Homes
- 533 NE Fargo St
- 3512 NE Grand Ave
- 0 NE Mlk and Fremont Blvd Unit 23325427
- 3621 NE 8th Ave
- 3562 NE Garfield Ave Unit 7
- 3558 NE Garfield Ave Unit 5
- 3554 NE Garfield Ave Unit 3
- 3552 NE Garfield Ave Unit 2
- 3550 NE Garfield Ave Unit 1
- 3564 NE Garfield Ave
- 3626 NE 8th Ave
- 3724 NE Grand Ave
- 3627 NE 9th Ave
- 3032 NE 8th Ave
- 3812 NE 7th Ave
- 78 NE Ivy St
- 3343 NE 12th Ave
- 3745 NE Mallory Ave
- 2845 NE Martin Luther King Junior Blvd
- 3817 NE 11th Ave