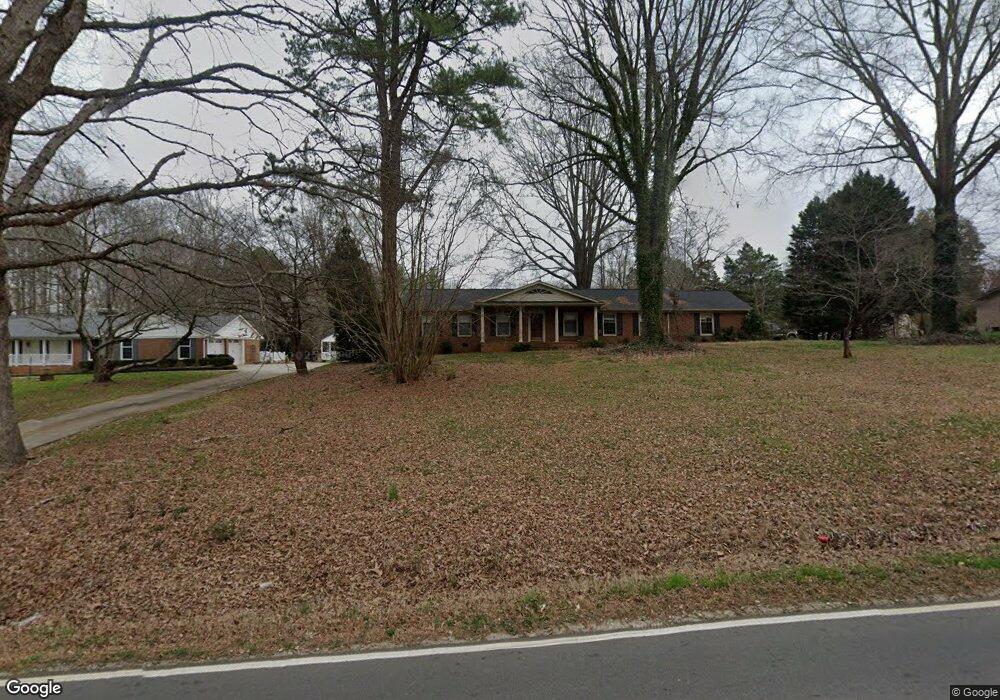
545 Neel Rd Salisbury, NC 28147
Estimated Value: $322,000 - $475,000
3
Beds
4
Baths
2,473
Sq Ft
$162/Sq Ft
Est. Value
About This Home
This home is located at 545 Neel Rd, Salisbury, NC 28147 and is currently estimated at $400,417, approximately $161 per square foot. 545 Neel Rd is a home located in Rowan County with nearby schools including Hurley Elementary School, West Rowan Middle School, and West Rowan High School.
Ownership History
Date
Name
Owned For
Owner Type
Purchase Details
Closed on
Oct 29, 2009
Sold by
Us Bank National Association
Bought by
Aldridge Robert L
Current Estimated Value
Home Financials for this Owner
Home Financials are based on the most recent Mortgage that was taken out on this home.
Original Mortgage
$93,500
Interest Rate
4.39%
Mortgage Type
Purchase Money Mortgage
Purchase Details
Closed on
Jul 14, 2009
Sold by
Gibson Fred and Gibson Lynette
Bought by
Us Bank National Association
Purchase Details
Closed on
May 20, 2004
Sold by
Burchett Lawrence F and Burchett Regina C
Bought by
Gibson Fred and Gibson Lynette
Home Financials for this Owner
Home Financials are based on the most recent Mortgage that was taken out on this home.
Original Mortgage
$146,400
Interest Rate
7.26%
Mortgage Type
Purchase Money Mortgage
Create a Home Valuation Report for This Property
The Home Valuation Report is an in-depth analysis detailing your home's value as well as a comparison with similar homes in the area
Purchase History
| Date | Buyer | Sale Price | Title Company |
|---|---|---|---|
| Aldridge Robert L | $110,000 | None Available | |
| Us Bank National Association | $151,606 | None Available | |
| Gibson Fred | $183,000 | -- |
Source: Public Records
Mortgage History
| Date | Status | Borrower | Loan Amount |
|---|---|---|---|
| Closed | Aldridge Robert L | $93,500 | |
| Previous Owner | Gibson Fred | $146,400 | |
| Closed | Gibson Fred | $36,600 |
Source: Public Records
Tax History
| Year | Tax Paid | Tax Assessment Tax Assessment Total Assessment is a certain percentage of the fair market value that is determined by local assessors to be the total taxable value of land and additions on the property. | Land | Improvement |
|---|---|---|---|---|
| 2025 | $2,426 | $358,076 | $38,000 | $320,076 |
| 2024 | $2,426 | $358,076 | $38,000 | $320,076 |
| 2023 | $2,426 | $358,076 | $38,000 | $320,076 |
| 2022 | $1,615 | $213,939 | $35,000 | $178,939 |
| 2021 | $1,599 | $213,939 | $35,000 | $178,939 |
| 2020 | $1,599 | $213,939 | $35,000 | $178,939 |
| 2019 | $1,599 | $213,939 | $35,000 | $178,939 |
| 2018 | $1,392 | $187,863 | $35,000 | $152,863 |
| 2017 | $1,392 | $187,863 | $35,000 | $152,863 |
| 2016 | $1,392 | $187,863 | $35,000 | $152,863 |
| 2015 | $1,409 | $187,863 | $35,000 | $152,863 |
| 2014 | $1,392 | $194,670 | $35,000 | $159,670 |
Source: Public Records
Map
Nearby Homes
- 170 Heritage Ln
- 245 Spicewood Ln Unit 25
- 135 Devon Dr
- 415 Autumnlight Dr
- 1500 N Carolina Highway 150
- 1456 N Carolina Highway 150
- 1466 N Carolina Highway 150
- 265 Prospect Trail
- 225 Roger Dr
- 202 Windmill Rd
- 0 Windmill Rd
- 325 Bonaventure Dr
- 335 Bonaventure Dr
- 2885 Wright Ave
- 1090 Mop Bucket Dr
- 4710 Mooresville Rd
- 2170 Neel Rd
- 4712 Mooresville Rd
- 308 Hickory Ln
- 325 Bob White Run