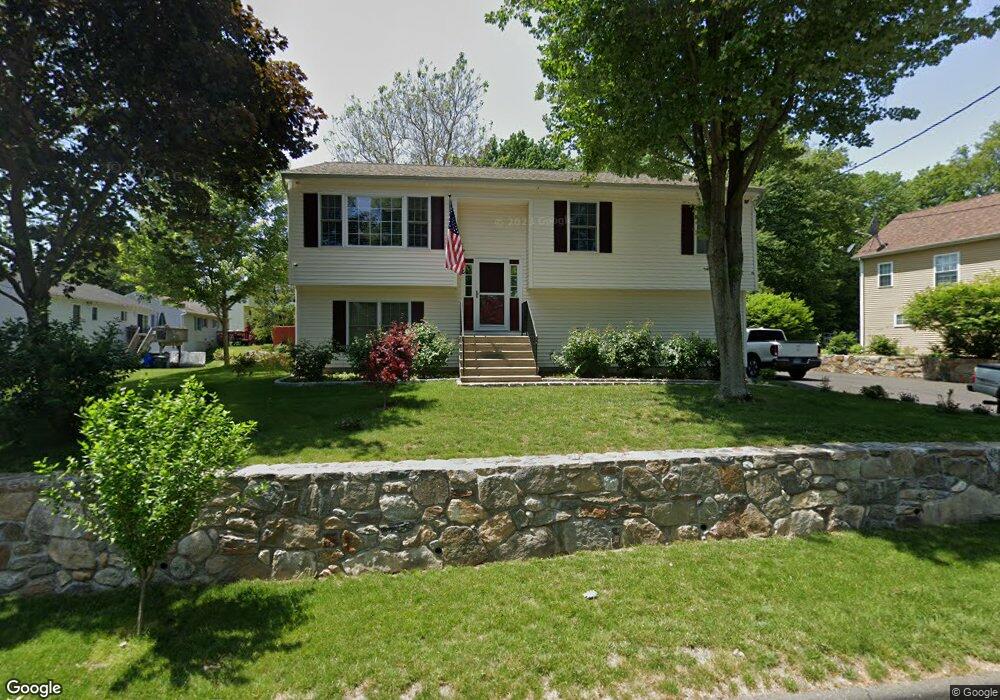
545 Pond St Bridgeport, CT 06606
Reservoir-Whiskey Hill NeighborhoodEstimated Value: $378,000 - $402,000
3
Beds
2
Baths
1,164
Sq Ft
$337/Sq Ft
Est. Value
About This Home
This home is located at 545 Pond St, Bridgeport, CT 06606 and is currently estimated at $392,605, approximately $337 per square foot. 545 Pond St is a home located in Fairfield County with nearby schools including Hallen School, Central High School, and Northeastern Adventist Academy - Fairfield County.
Ownership History
Date
Name
Owned For
Owner Type
Purchase Details
Closed on
May 17, 2000
Sold by
Real Est Mngnt Llc
Bought by
Calder Jorge J and Calder Maria A
Current Estimated Value
Home Financials for this Owner
Home Financials are based on the most recent Mortgage that was taken out on this home.
Original Mortgage
$123,920
Interest Rate
8.19%
Create a Home Valuation Report for This Property
The Home Valuation Report is an in-depth analysis detailing your home's value as well as a comparison with similar homes in the area
Home Values in the Area
Average Home Value in this Area
Purchase History
| Date | Buyer | Sale Price | Title Company |
|---|---|---|---|
| Calder Jorge J | $154,900 | -- | |
| Calder Jorge J | $154,900 | -- |
Source: Public Records
Mortgage History
| Date | Status | Borrower | Loan Amount |
|---|---|---|---|
| Open | Calder Jorge J | $123,000 | |
| Closed | Calder Jorge J | $123,920 | |
| Closed | Calder Jorge J | $5,000 |
Source: Public Records
Tax History Compared to Growth
Tax History
| Year | Tax Paid | Tax Assessment Tax Assessment Total Assessment is a certain percentage of the fair market value that is determined by local assessors to be the total taxable value of land and additions on the property. | Land | Improvement |
|---|---|---|---|---|
| 2025 | $7,222 | $166,220 | $68,520 | $97,700 |
| 2024 | $7,222 | $166,220 | $68,520 | $97,700 |
| 2023 | $7,222 | $166,220 | $68,520 | $97,700 |
| 2022 | $7,222 | $166,220 | $68,520 | $97,700 |
| 2021 | $7,222 | $166,220 | $68,520 | $97,700 |
| 2020 | $6,977 | $129,230 | $39,430 | $89,800 |
| 2019 | $6,977 | $129,230 | $39,430 | $89,800 |
| 2018 | $7,026 | $129,230 | $39,430 | $89,800 |
| 2017 | $7,026 | $129,230 | $39,430 | $89,800 |
| 2016 | $7,026 | $129,230 | $39,430 | $89,800 |
| 2015 | $6,682 | $158,350 | $45,190 | $113,160 |
| 2014 | $6,682 | $158,350 | $45,190 | $113,160 |
Source: Public Records
Map
Nearby Homes
- 123 Exeter St
- 385 Chamberlain Ave
- 330 Oakwood St
- 45 Polk St
- 355 Chamberlain Ave
- 138 Infield St
- 500 Woodlawn Avenue Extension
- 355 Exeter St
- 213 Exeter St
- 219 Exeter St
- 365 Platt St
- 285 Alba Ave
- 410 Alba Ave
- 39 Infield St
- 245 Indian Ave
- 235 Indian Ave
- 675 Platt St
- 25 Broadway
- 130 Wilkins Ave
- 45 Stevens St Unit 2