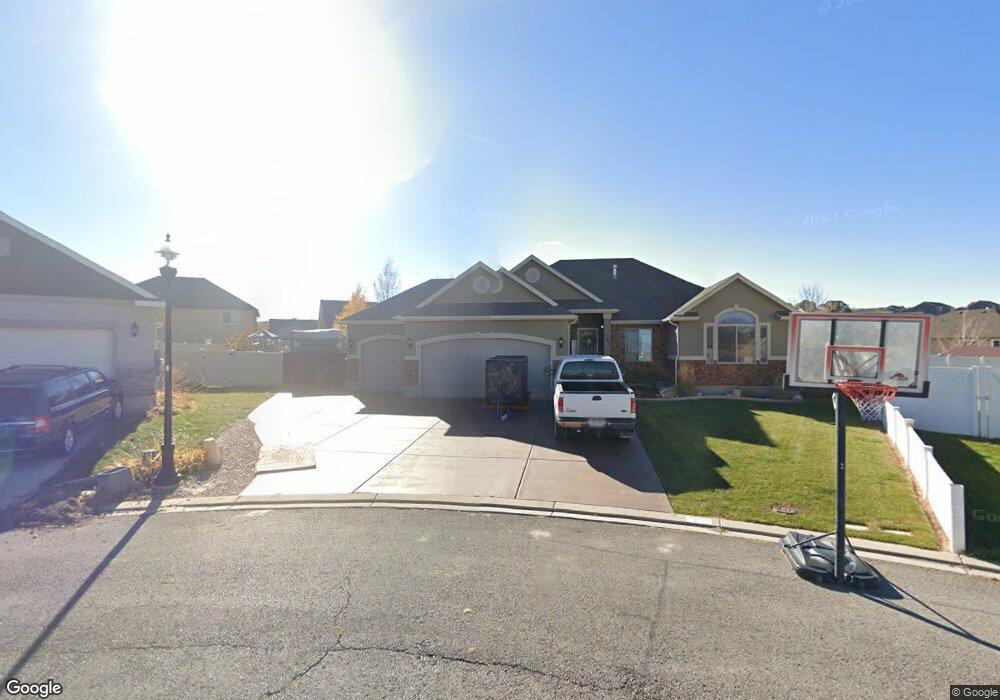
545 S Little Rock Sh W Unit NEBO Santaquin, UT 84655
Estimated Value: $520,000 - $588,000
3
Beds
2
Baths
3,030
Sq Ft
$183/Sq Ft
Est. Value
About This Home
This home is located at 545 S Little Rock Sh W Unit NEBO, Santaquin, UT 84655 and is currently estimated at $554,711, approximately $183 per square foot. 545 S Little Rock Sh W Unit NEBO is a home located in Utah County with nearby schools including Santaquin Elementary School, Payson Junior High School, and Payson High School.
Ownership History
Date
Name
Owned For
Owner Type
Purchase Details
Closed on
Dec 10, 2024
Sold by
Inga Marco A Rojas
Bought by
Inga Marco A Rojas and Bastidas Liz Nasely
Current Estimated Value
Home Financials for this Owner
Home Financials are based on the most recent Mortgage that was taken out on this home.
Original Mortgage
$23,200
Outstanding Balance
$23,009
Interest Rate
6.54%
Estimated Equity
$531,702
Purchase Details
Closed on
Dec 8, 2024
Sold by
Hunt Gregory J and Hunt Shannon
Bought by
Inga Marco A Rojas
Home Financials for this Owner
Home Financials are based on the most recent Mortgage that was taken out on this home.
Original Mortgage
$23,200
Outstanding Balance
$23,009
Interest Rate
6.54%
Estimated Equity
$531,702
Purchase Details
Closed on
Jul 29, 2015
Sold by
Salisbury Land Llc
Bought by
Salisbury Developers Inc
Home Financials for this Owner
Home Financials are based on the most recent Mortgage that was taken out on this home.
Original Mortgage
$174,700
Interest Rate
3.98%
Mortgage Type
Construction
Purchase Details
Closed on
Sep 29, 2011
Sold by
Summit Ridge Communities Llc
Bought by
Central Bank
Create a Home Valuation Report for This Property
The Home Valuation Report is an in-depth analysis detailing your home's value as well as a comparison with similar homes in the area
Home Values in the Area
Average Home Value in this Area
Purchase History
| Date | Buyer | Sale Price | Title Company |
|---|---|---|---|
| Inga Marco A Rojas | -- | First American Title Insurance | |
| Inga Marco A Rojas | -- | First American Title Insurance | |
| Inga Marco A Rojas | -- | Citadel Title | |
| Inga Marco A Rojas | -- | Citadel Title | |
| Salisbury Developers Inc | -- | Gt Title Services | |
| Central Bank | -- | None Available |
Source: Public Records
Mortgage History
| Date | Status | Borrower | Loan Amount |
|---|---|---|---|
| Open | Inga Marco A Rojas | $23,200 | |
| Closed | Inga Marco A Rojas | $23,200 | |
| Open | Inga Marco A Rojas | $535,128 | |
| Closed | Inga Marco A Rojas | $535,128 | |
| Previous Owner | Salisbury Developers Inc | $174,700 |
Source: Public Records
Tax History Compared to Growth
Tax History
| Year | Tax Paid | Tax Assessment Tax Assessment Total Assessment is a certain percentage of the fair market value that is determined by local assessors to be the total taxable value of land and additions on the property. | Land | Improvement |
|---|---|---|---|---|
| 2025 | $2,509 | $517,900 | $144,700 | $373,200 |
| 2024 | $2,509 | $249,865 | $0 | $0 |
| 2023 | $2,583 | $258,060 | $0 | $0 |
| 2022 | $2,776 | $286,000 | $0 | $0 |
| 2021 | $2,424 | $387,200 | $81,600 | $305,600 |
| 2020 | $2,338 | $361,800 | $68,000 | $293,800 |
| 2019 | $1,782 | $282,000 | $64,400 | $217,600 |
| 2018 | $1,633 | $246,500 | $57,300 | $189,200 |
| 2017 | $1,513 | $121,990 | $0 | $0 |
| 2016 | $1,398 | $110,495 | $0 | $0 |
| 2015 | $480 | $37,200 | $0 | $0 |
| 2014 | $481 | $37,200 | $0 | $0 |
Source: Public Records
Map
Nearby Homes
- 519 Stone Way
- 449 Travertine Way
- 633 Little Rock Dr
- 583 Sunset Dr
- 402 Topaz Dr
- 490 Firestone Dr
- 346 Red Rock Dr
- 926 S Tanner Rd
- 686 W Frost St Unit 86
- 688 Frost St Unit 85
- 692 Frost St Unit 84
- 696 W Frost St
- 688 W Frost St
- 1022 Vista Ridge Dr Unit 149
- 1103 Vista Ridge Dr
- 1144 Crest Dale Ln
- 1217 Crest Dale Ln
- 1208 Crest Dale Ln
- 1226 Crest Dale Ln
- 1263 Crest Dale Ln
- 545 Little Rock Dr Unit 43
- 545 Little Rock Dr Unit CONCOR
- 541 Little Rock Dr
- 549 Little Rock Dr
- 539 Little Rock Dr
- 552 Little Rock Cir
- 613 S Little Rock Cir
- 552 Little Rock Cir
- 557 Little Rock Dr
- 557 Little Rock Dr Unit 49
- 557 Little Rock Dr Unit 45
- 557 Little Rock Dr Unit NEBO
- 538 Little Rock Dr
- 557 Little Rock Dr
- 556 Little Rock Cir
- 529 Little Rock Dr
- 558 Little Rock Dr
- 563 Little Rock Dr
- 563 Little Rock Dr
- 528 Little Rock Dr Unit 114