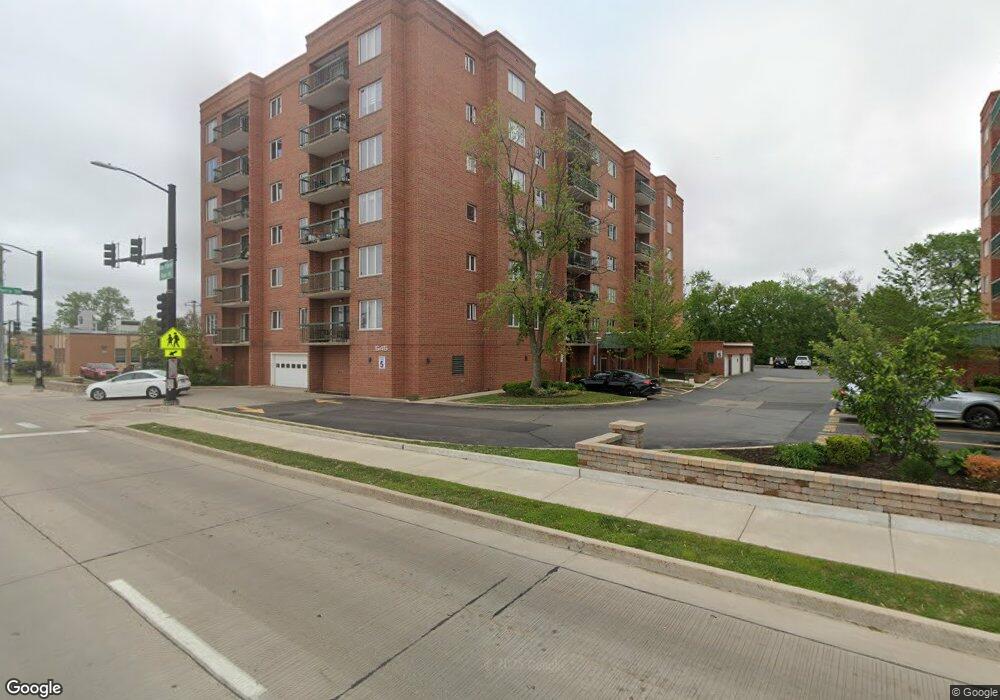
Riverwalk North 545 S River Rd Unit 608A Des Plaines, IL 60016
Estimated Value: $265,000 - $376,000
2
Beds
2
Baths
1,260
Sq Ft
$242/Sq Ft
Est. Value
About This Home
This home is located at 545 S River Rd Unit 608A, Des Plaines, IL 60016 and is currently estimated at $305,358, approximately $242 per square foot. 545 S River Rd Unit 608A is a home located in Cook County with nearby schools including North Elementary School, Chippewa Middle School, and Maine West High School.
Ownership History
Date
Name
Owned For
Owner Type
Purchase Details
Closed on
Dec 1, 2017
Sold by
Potter Karen A and Potter Daniel A
Bought by
Steinbeiss Laurie A
Current Estimated Value
Home Financials for this Owner
Home Financials are based on the most recent Mortgage that was taken out on this home.
Original Mortgage
$117,000
Outstanding Balance
$97,389
Interest Rate
3.87%
Mortgage Type
New Conventional
Estimated Equity
$207,969
Purchase Details
Closed on
Aug 9, 2004
Sold by
Sukrakanchana Pattra and Pelletier Pattra
Bought by
Heinz Karen A
Home Financials for this Owner
Home Financials are based on the most recent Mortgage that was taken out on this home.
Original Mortgage
$160,000
Interest Rate
6.08%
Mortgage Type
Unknown
Create a Home Valuation Report for This Property
The Home Valuation Report is an in-depth analysis detailing your home's value as well as a comparison with similar homes in the area
Home Values in the Area
Average Home Value in this Area
Purchase History
| Date | Buyer | Sale Price | Title Company |
|---|---|---|---|
| Steinbeiss Laurie A | $195,000 | Chicago Title | |
| Heinz Karen A | $220,000 | Multiple |
Source: Public Records
Mortgage History
| Date | Status | Borrower | Loan Amount |
|---|---|---|---|
| Open | Steinbeiss Laurie A | $117,000 | |
| Previous Owner | Heinz Karen A | $160,000 |
Source: Public Records
Tax History
| Year | Tax Paid | Tax Assessment Tax Assessment Total Assessment is a certain percentage of the fair market value that is determined by local assessors to be the total taxable value of land and additions on the property. | Land | Improvement |
|---|---|---|---|---|
| 2025 | $3,871 | $27,289 | $774 | $26,515 |
| 2024 | $3,871 | $18,000 | $688 | $17,312 |
| 2023 | $3,751 | $18,000 | $688 | $17,312 |
| 2022 | $3,751 | $18,000 | $688 | $17,312 |
| 2021 | $3,595 | $15,024 | $558 | $14,466 |
| 2020 | $3,603 | $15,024 | $558 | $14,466 |
| 2019 | $3,583 | $16,743 | $558 | $16,185 |
| 2018 | $3,050 | $13,633 | $494 | $13,139 |
| 2017 | $3,013 | $13,633 | $494 | $13,139 |
| 2016 | $3,094 | $13,633 | $494 | $13,139 |
| 2015 | $2,753 | $11,731 | $429 | $11,302 |
| 2014 | $2,713 | $11,737 | $435 | $11,302 |
| 2013 | $2,628 | $11,737 | $435 | $11,302 |
Source: Public Records
About Riverwalk North
Map
Nearby Homes
- 545 S River Rd Unit 307A
- 603 S River Rd Unit 2M
- 650 S River Rd Unit 801
- 650 S River Rd Unit 812
- 1685 Mill St Unit 605
- 430 Oak St
- 711 S River Rd Unit 704
- 1389 Perry St Unit 303
- 750 Pearson St Unit 904
- 770 Pearson St Unit 2207
- 395 Graceland Ave Unit 208
- 1374 Jefferson St
- 365 Graceland Ave Unit 205A
- 1601 Sherman Place
- 1347 Perry St Unit 4
- 1349 E Washington St Unit 404A
- 1330 Perry St Unit 504
- 1325 Perry St Unit 606
- 821 Lexington Cir E
- 1578 Woodland Ave Unit D
- 545 S River Rd Unit 206A
- 545 S River Rd Unit 205A
- 545 S River Rd Unit 703A
- 545 S River Rd Unit 203A
- 545 S River Rd Unit 605A
- 545 S River Rd Unit 604A
- 545 S River Rd Unit 406A
- 545 S River Rd Unit 403A
- 545 S River Rd Unit 706A
- 545 S River Rd Unit 707A
- 545 S River Rd Unit 705A
- 545 S River Rd Unit 401A
- 545 S River Rd Unit 501A
- 545 S River Rd Unit 304A
- 545 S River Rd Unit 504A
- 545 S River Rd Unit 407A
- 545 S River Rd Unit 507A
- 545 S River Rd Unit 208A
- 545 S River Rd Unit 204A
- 545 S River Rd Unit 607A
Your Personal Tour Guide
Ask me questions while you tour the home.