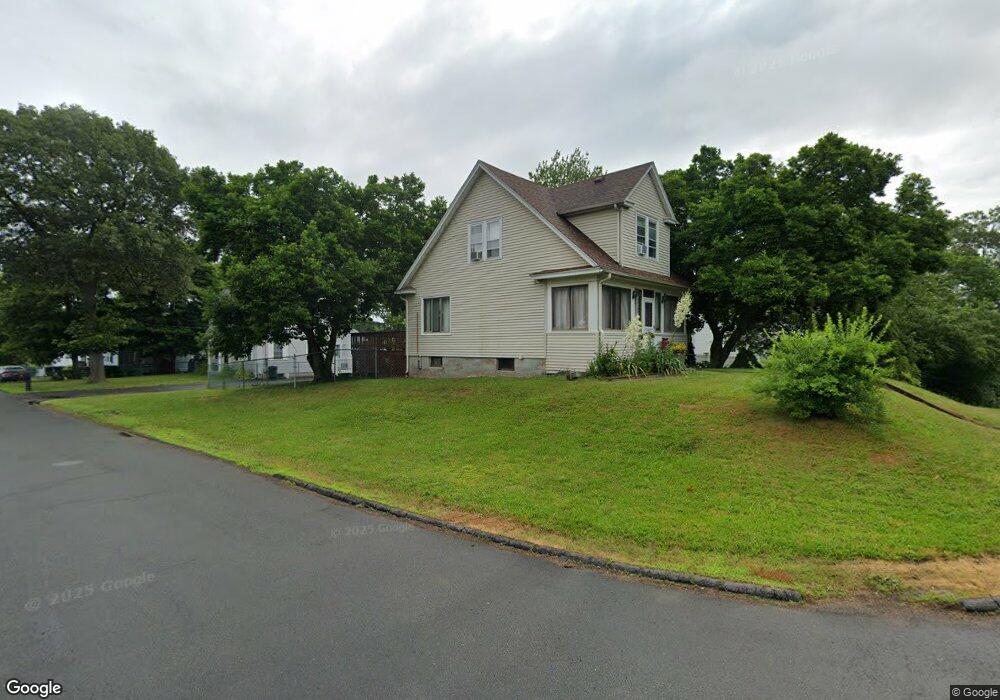
545 Strong St East Haven, CT 06512
Estimated Value: $352,362 - $426,000
3
Beds
2
Baths
1,638
Sq Ft
$238/Sq Ft
Est. Value
About This Home
This home is located at 545 Strong St, East Haven, CT 06512 and is currently estimated at $389,341, approximately $237 per square foot. 545 Strong St is a home located in New Haven County with nearby schools including Deer Run School, East Haven High School, and All Nations Christian Academy.
Ownership History
Date
Name
Owned For
Owner Type
Purchase Details
Closed on
Oct 10, 2002
Sold by
Grzymala Helen E
Bought by
Lugo Capor Idalia and Caporal Gustavp
Current Estimated Value
Home Financials for this Owner
Home Financials are based on the most recent Mortgage that was taken out on this home.
Original Mortgage
$172,636
Interest Rate
6.24%
Create a Home Valuation Report for This Property
The Home Valuation Report is an in-depth analysis detailing your home's value as well as a comparison with similar homes in the area
Home Values in the Area
Average Home Value in this Area
Purchase History
| Date | Buyer | Sale Price | Title Company |
|---|---|---|---|
| Lugo Capor Idalia | $174,000 | -- |
Source: Public Records
Mortgage History
| Date | Status | Borrower | Loan Amount |
|---|---|---|---|
| Open | Lugo Capor Idalia | $200,000 | |
| Closed | Lugo Capor Idalia | $172,636 |
Source: Public Records
Tax History Compared to Growth
Tax History
| Year | Tax Paid | Tax Assessment Tax Assessment Total Assessment is a certain percentage of the fair market value that is determined by local assessors to be the total taxable value of land and additions on the property. | Land | Improvement |
|---|---|---|---|---|
| 2025 | $4,476 | $133,840 | $43,540 | $90,300 |
| 2024 | $4,476 | $133,840 | $43,540 | $90,300 |
| 2023 | $4,176 | $133,840 | $43,540 | $90,300 |
| 2022 | $4,176 | $133,840 | $43,540 | $90,300 |
| 2021 | $4,040 | $117,960 | $40,370 | $77,590 |
| 2020 | $4,040 | $117,960 | $40,370 | $77,590 |
| 2019 | $3,783 | $116,680 | $40,370 | $76,310 |
| 2018 | $3,769 | $116,160 | $39,850 | $76,310 |
| 2017 | $3,665 | $116,160 | $39,850 | $76,310 |
| 2016 | $4,031 | $127,770 | $39,850 | $87,920 |
| 2015 | $4,031 | $127,770 | $39,850 | $87,920 |
| 2014 | $4,095 | $127,770 | $39,850 | $87,920 |
Source: Public Records
Map
Nearby Homes
- 173 Russo Ave Unit 610
- 173 Russo Ave Unit 409
- 90 Foxon Blvd
- 66 John St
- 140 Thompson St Unit 16E
- 140 Thompson St Unit 14A
- 140 Thompson St Unit 13C
- 140 Thompson St Unit 5B
- 55 Thompson St Unit 8H
- 55 Thompson St Unit 6E
- 75 Redwood Dr Unit 609
- 91 Angela Dr
- 15 Cedar Ct Unit G
- 1423 Quinnipiac Ave Unit 115
- 1423 Quinnipiac Ave Unit 709
- 1423 Quinnipiac Ave Unit 602
- 1423 Quinnipiac Ave Unit 707
- 1423 Quinnipiac Ave Unit 108
- 1423 Quinnipiac Ave Unit 808
- 1445 Quinnipiac Ave