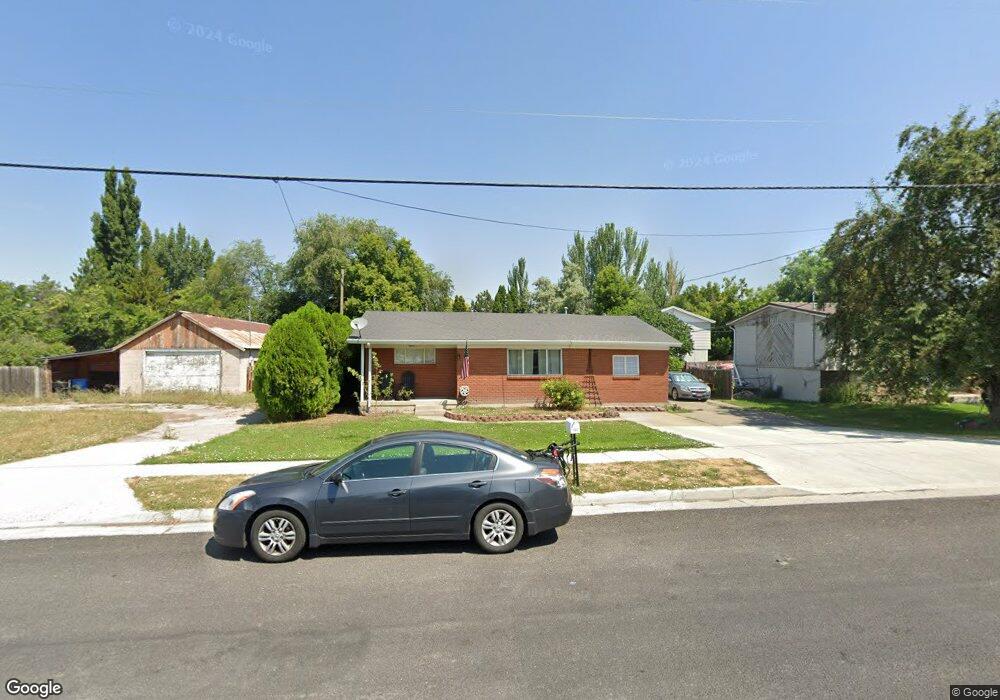
545 W 400 S Logan, UT 84321
Woodruff NeighborhoodEstimated Value: $368,000 - $394,213
3
Beds
2
Baths
1,262
Sq Ft
$302/Sq Ft
Est. Value
About This Home
This home is located at 545 W 400 S, Logan, UT 84321 and is currently estimated at $380,553, approximately $301 per square foot. 545 W 400 S is a home located in Cache County with nearby schools including Woodruff School, Mount Logan Middle School, and Logan High School.
Ownership History
Date
Name
Owned For
Owner Type
Purchase Details
Closed on
Jun 26, 2023
Sold by
Hammond Matthew
Bought by
Larsen Maxton Anthony
Current Estimated Value
Home Financials for this Owner
Home Financials are based on the most recent Mortgage that was taken out on this home.
Original Mortgage
$289,275
Outstanding Balance
$280,861
Interest Rate
6.35%
Mortgage Type
VA
Estimated Equity
$99,692
Purchase Details
Closed on
Jan 1, 2023
Sold by
Visionary Homes 2022 Llc
Bought by
Hammond Rachael and Hammond Steven Michael
Home Financials for this Owner
Home Financials are based on the most recent Mortgage that was taken out on this home.
Original Mortgage
$428,678
Interest Rate
6.33%
Mortgage Type
New Conventional
Purchase Details
Closed on
Jul 30, 2015
Sold by
Utah Renovations Lc
Bought by
Hammond Matthew
Home Financials for this Owner
Home Financials are based on the most recent Mortgage that was taken out on this home.
Original Mortgage
$151,848
Interest Rate
4.25%
Mortgage Type
FHA
Purchase Details
Closed on
Jul 11, 2014
Sold by
Gil Salinas Hugo Enrique and Gil Del Salinas Monica
Bought by
Utah Renovations Lc
Create a Home Valuation Report for This Property
The Home Valuation Report is an in-depth analysis detailing your home's value as well as a comparison with similar homes in the area
Home Values in the Area
Average Home Value in this Area
Purchase History
| Date | Buyer | Sale Price | Title Company |
|---|---|---|---|
| Larsen Maxton Anthony | -- | Advanced Title | |
| Hammond Rachael | -- | -- | |
| Hammond Matthew | -- | Advanced Title | |
| Utah Renovations Lc | $87,126 | Select Title Ins Agency Inc |
Source: Public Records
Mortgage History
| Date | Status | Borrower | Loan Amount |
|---|---|---|---|
| Open | Larsen Maxton Anthony | $289,275 | |
| Previous Owner | Hammond Rachael | $428,678 | |
| Previous Owner | Hammond Matthew | $151,848 |
Source: Public Records
Tax History
| Year | Tax Paid | Tax Assessment Tax Assessment Total Assessment is a certain percentage of the fair market value that is determined by local assessors to be the total taxable value of land and additions on the property. | Land | Improvement |
|---|---|---|---|---|
| 2025 | $1,631 | $210,945 | $0 | $0 |
| 2024 | $1,681 | $210,575 | $0 | $0 |
| 2023 | $1,751 | $209,080 | $0 | $0 |
| 2022 | $1,545 | $172,235 | $0 | $0 |
| 2021 | $1,410 | $242,850 | $42,000 | $200,850 |
| 2020 | $1,268 | $196,500 | $42,000 | $154,500 |
| 2019 | $1,325 | $196,500 | $42,000 | $154,500 |
| 2018 | $1,103 | $149,408 | $42,000 | $107,408 |
| 2017 | $1,029 | $73,645 | $0 | $0 |
| 2016 | $1,066 | $73,645 | $0 | $0 |
| 2015 | $1,068 | $73,645 | $0 | $0 |
| 2014 | $965 | $73,645 | $0 | $0 |
| 2013 | -- | $69,610 | $0 | $0 |
Source: Public Records
Map
Nearby Homes
Your Personal Tour Guide
Ask me questions while you tour the home.