Estimated Value: $353,000 - $391,000
2
Beds
1
Bath
1,794
Sq Ft
$207/Sq Ft
Est. Value
About This Home
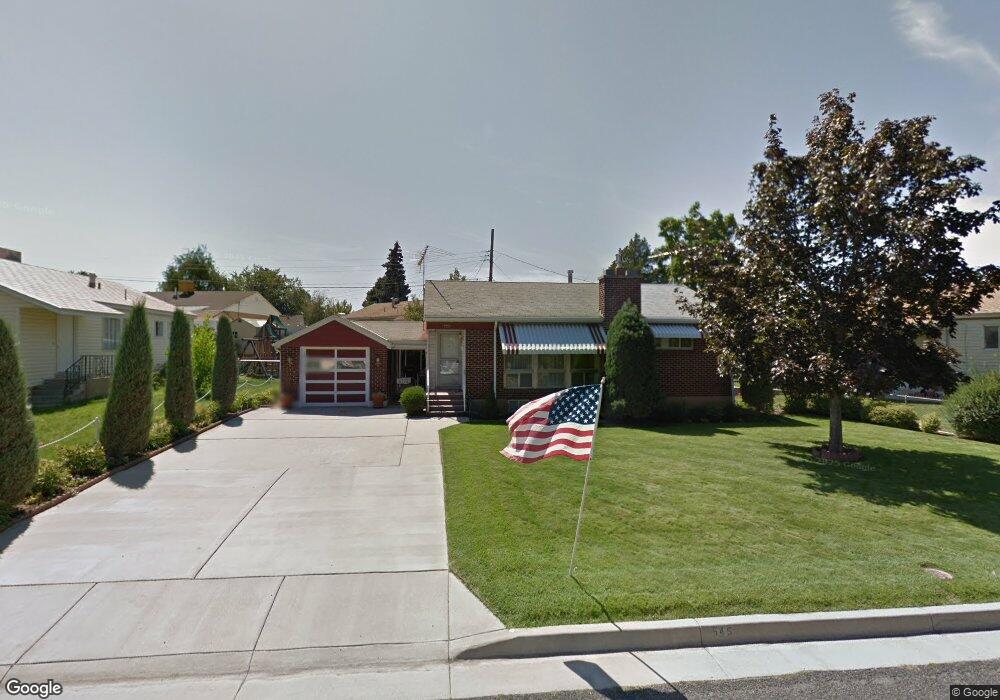
This home is located at 545 W 5150 S, Ogden, UT 84405 and is currently estimated at $370,975, approximately $206 per square foot. 545 W 5150 S is a home located in Weber County with nearby schools including Roosevelt School, T.H. Bell Junior High School, and Bonneville High School.
Ownership History
Date
Name
Owned For
Owner Type
Purchase Details
Closed on
Oct 24, 2023
Sold by
Foerster James and Foerster Michelle
Bought by
Lesley Skyler David and Geukgeuzian Megan
Current Estimated Value
Home Financials for this Owner
Home Financials are based on the most recent Mortgage that was taken out on this home.
Original Mortgage
$6,171
Outstanding Balance
$6,051
Interest Rate
7.18%
Estimated Equity
$364,924
Purchase Details
Closed on
Sep 9, 2014
Sold by
The Trust Of John R Dallinga
Bought by
Foerster James
Purchase Details
Closed on
Apr 11, 2008
Sold by
Dallinga John R and Dallinga Wanda R
Bought by
The Trust Of John R Dallinga
Purchase Details
Closed on
Apr 24, 2002
Sold by
Dallinga John R and Dallinga Wanda D
Bought by
The Family Trust Of John R & Wanda D Dal
Create a Home Valuation Report for This Property
The Home Valuation Report is an in-depth analysis detailing your home's value as well as a comparison with similar homes in the area
Home Values in the Area
Average Home Value in this Area
Purchase History
| Date | Buyer | Sale Price | Title Company |
|---|---|---|---|
| Lesley Skyler David | -- | Stewart Title | |
| Foerster James | -- | Mountain View Title | |
| The Trust Of John R Dallinga | -- | None Available | |
| The Family Trust Of John R & Wanda D Dal | -- | -- |
Source: Public Records
Mortgage History
| Date | Status | Borrower | Loan Amount |
|---|---|---|---|
| Open | Lesley Skyler David | $6,171 | |
| Open | Lesley Skyler David | $335,805 |
Source: Public Records
Tax History Compared to Growth
Tax History
| Year | Tax Paid | Tax Assessment Tax Assessment Total Assessment is a certain percentage of the fair market value that is determined by local assessors to be the total taxable value of land and additions on the property. | Land | Improvement |
|---|---|---|---|---|
| 2025 | $2,351 | $365,792 | $120,959 | $244,833 |
| 2024 | $2,351 | $195,249 | $66,527 | $128,722 |
| 2023 | $2,216 | $183,150 | $64,156 | $118,994 |
| 2022 | $2,335 | $201,300 | $61,419 | $139,881 |
| 2021 | $2,043 | $288,000 | $60,503 | $227,497 |
| 2020 | $1,743 | $220,000 | $49,626 | $170,374 |
| 2019 | $1,719 | $201,000 | $49,626 | $151,374 |
| 2018 | $1,465 | $165,000 | $49,626 | $115,374 |
| 2017 | $1,344 | $140,000 | $34,343 | $105,657 |
| 2016 | $1,261 | $71,391 | $17,982 | $53,409 |
| 2015 | $1,280 | $71,391 | $17,982 | $53,409 |
| 2014 | $1,261 | $69,762 | $17,982 | $51,780 |
Source: Public Records
Map
Nearby Homes
- 548 W 5150 S
- 5155 S Ridgeline Dr
- 445 W 5100 S
- 5282 S 575 W
- 405 W 5100 S
- 390 W 5050 S
- 409 W 5000 S
- 376 W 5300 S
- 4931 S 300 W
- 246 W 5000 S
- 5226 S 200 W
- 5465 S 250 W
- 295 W 5650 S
- 4670 S 475 W
- 5228 900 W Unit 217
- 5100 S 1050 W Unit E37
- 5100 S 1050 W Unit G109
- 5100 S 1050 W Unit A182
- 5100 S 1050 W Unit A74
- 5100 S 1050 W Unit A180