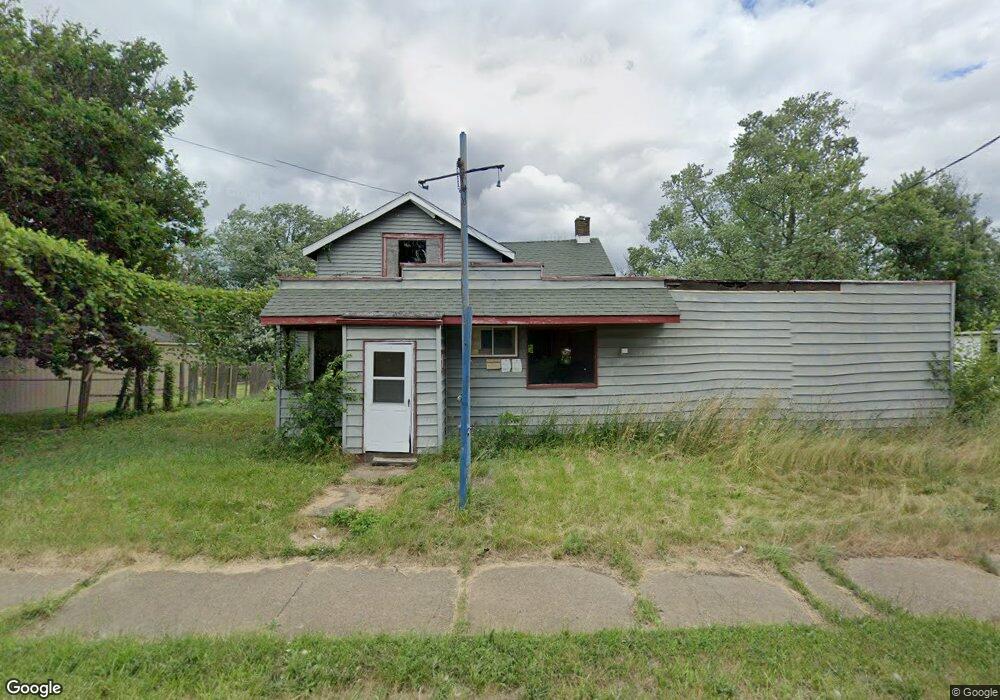
545 W Ely St Alliance, OH 44601
1
Bed
1
Bath
532
Sq Ft
10,019
Sq Ft Lot
About This Home
This home is located at 545 W Ely St, Alliance, OH 44601. 545 W Ely St is a home located in Stark County with nearby schools including Alliance Early Learning School, Alliance Intermediate School at Northside, and Alliance Middle School.
Ownership History
Date
Name
Owned For
Owner Type
Purchase Details
Closed on
Feb 23, 2026
Sold by
Stark County Land Reutilization Corporat
Bought by
City Of Alliance
Purchase Details
Closed on
Jun 16, 2015
Sold by
Crow Hope
Bought by
Hughes Joey James
Purchase Details
Closed on
Oct 14, 2014
Sold by
Moats Katrina
Bought by
Crow Hope
Purchase Details
Closed on
Aug 17, 2011
Sold by
Moats Katrina
Bought by
Brady Sharon
Home Financials for this Owner
Home Financials are based on the most recent Mortgage that was taken out on this home.
Original Mortgage
$43,500
Interest Rate
6%
Mortgage Type
Seller Take Back
Purchase Details
Closed on
Aug 3, 2009
Sold by
Collage Tracy
Bought by
Moats Katrina
Purchase Details
Closed on
May 1, 2009
Sold by
Crowe Hope
Bought by
Collage Tracy
Purchase Details
Closed on
Aug 13, 2003
Sold by
Bonfert Patricia L
Bought by
Crow Hope
Purchase Details
Closed on
Oct 28, 1999
Sold by
Marshall Donald W and Marshall Millicent K
Bought by
Boone Dianne
Purchase Details
Closed on
Jul 30, 1990
Create a Home Valuation Report for This Property
The Home Valuation Report is an in-depth analysis detailing your home's value as well as a comparison with similar homes in the area
Home Values in the Area
Average Home Value in this Area
Purchase History
| Date | Buyer | Sale Price | Title Company |
|---|---|---|---|
| City Of Alliance | -- | None Listed On Document | |
| Hughes Joey James | $9,000 | None Available | |
| Crow Hope | $35,000 | None Available | |
| Brady Sharon | $60,000 | Attorney | |
| Moats Katrina | $20,000 | None Available | |
| Collage Tracy | $20,000 | None Available | |
| Crow Hope | $45,000 | Union Title Co | |
| Boone Dianne | $25,000 | -- | |
| -- | $40,000 | -- |
Source: Public Records
Mortgage History
| Date | Status | Borrower | Loan Amount |
|---|---|---|---|
| Previous Owner | Brady Sharon | $43,500 |
Source: Public Records
Tax History
| Year | Tax Paid | Tax Assessment Tax Assessment Total Assessment is a certain percentage of the fair market value that is determined by local assessors to be the total taxable value of land and additions on the property. | Land | Improvement |
|---|---|---|---|---|
| 2025 | $15,317 | $52,540 | $4,310 | $48,230 |
| 2024 | $11,550 | $52,540 | $4,310 | $48,230 |
| 2023 | $11,249 | $13,130 | $4,380 | $8,750 |
| 2022 | $1,353 | $13,130 | $4,380 | $8,750 |
| 2021 | $1,049 | $13,130 | $4,380 | $8,750 |
| 2020 | $886 | $11,940 | $3,990 | $7,950 |
| 2019 | $2,069 | $11,950 | $3,990 | $7,960 |
| 2018 | $1,161 | $11,950 | $3,990 | $7,960 |
| 2017 | $3,718 | $10,830 | $2,450 | $8,380 |
| 2016 | $2,902 | $10,830 | $2,450 | $8,380 |
| 2015 | $659 | $10,830 | $2,450 | $8,380 |
| 2014 | $928 | $11,000 | $2,450 | $8,550 |
| 2013 | $162 | $11,000 | $2,450 | $8,550 |
Source: Public Records
Map
Nearby Homes
- 33 S Lincoln Ave
- 118 S Mckinley Ave
- 264 W Market St
- 343 W Columbia St
- 171 1/2 W Main St
- 163 W Market St
- 717 Garfield Ave
- 479 W High St
- 160 Bonnieview Ave
- 505 N Union Ave
- 432 Johnson Ave
- 347 Buckeye Ave
- 319 W Oxford St
- 550 Johnson Ave
- 62 E Market St
- 535 S Mckinley Ave
- 228 W Oxford St
- 710 N Freedom Ave
- 233 W Cambridge St
- 000 Meadowbrook Ave
- 575 W Ely St
- 499 W Ely St
- 544 W Harrison St
- 522 W Harrison St
- 324 Mckinley Ct
- 510 W Harrison St
- 336 Mckinley Ct
- 583 W Ely St
- 554 W Harrison St
- 469 W Ely St
- 498 W Harrison St
- 510 W Ely St
- 325 Mckinley Ct
- 335 N Rockhill Ave
- 335 Mckinley Ct
- 490 W Harrison St
- 461 W Ely St
- 351 N Rockhill Ave
- 453 W Ely St
- 588 W Harrison St
Your Personal Tour Guide
Ask me questions while you tour the home.