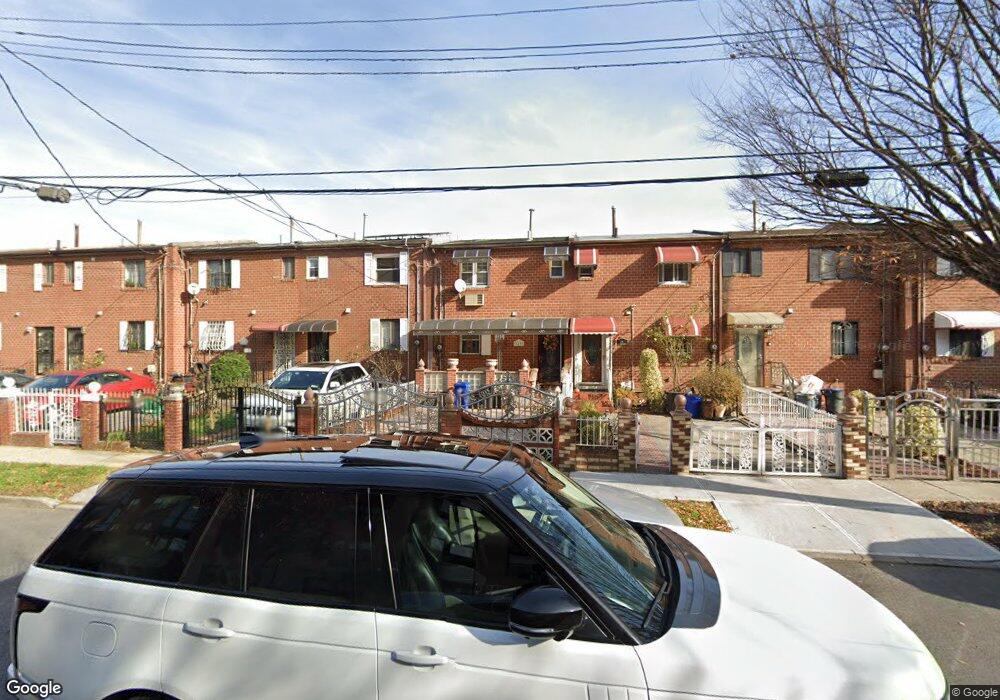
545 Watkins St Brooklyn, NY 11212
Brownsville NeighborhoodEstimated Value: $592,000 - $679,000
3
Beds
3
Baths
1,116
Sq Ft
$567/Sq Ft
Est. Value
About This Home
This home is located at 545 Watkins St, Brooklyn, NY 11212 and is currently estimated at $632,397, approximately $566 per square foot. 545 Watkins St is a home located in Kings County with nearby schools including P.S. 165 Ida Posner, P.S. 150 - Christopher, and P.S. 156 Waverly.
Ownership History
Date
Name
Owned For
Owner Type
Purchase Details
Closed on
May 6, 2021
Sold by
Davis As Trustee Roland C and Donna Davis Revocable Trust
Bought by
Bobb-Rodney Allison and Bobb-Rodney Wendell R
Current Estimated Value
Home Financials for this Owner
Home Financials are based on the most recent Mortgage that was taken out on this home.
Original Mortgage
$548,875
Outstanding Balance
$494,492
Interest Rate
3%
Mortgage Type
Purchase Money Mortgage
Estimated Equity
$137,905
Purchase Details
Closed on
Jan 7, 2019
Sold by
Davis Donna
Bought by
Ronald C Davis Trustee and The Donna Davis Revocable Trust
Purchase Details
Closed on
Oct 27, 2008
Sold by
Davis Idona
Bought by
Davis Donna
Home Financials for this Owner
Home Financials are based on the most recent Mortgage that was taken out on this home.
Original Mortgage
$20,378
Interest Rate
6.08%
Mortgage Type
Purchase Money Mortgage
Create a Home Valuation Report for This Property
The Home Valuation Report is an in-depth analysis detailing your home's value as well as a comparison with similar homes in the area
Home Values in the Area
Average Home Value in this Area
Purchase History
| Date | Buyer | Sale Price | Title Company |
|---|---|---|---|
| Bobb-Rodney Allison | $559,000 | -- | |
| Ronald C Davis Trustee | -- | -- | |
| Davis Donna | -- | -- | |
| Davis Donna | -- | -- |
Source: Public Records
Mortgage History
| Date | Status | Borrower | Loan Amount |
|---|---|---|---|
| Open | Bobb-Rodney Allison | $548,875 | |
| Previous Owner | Davis Donna | $20,378 |
Source: Public Records
Tax History Compared to Growth
Tax History
| Year | Tax Paid | Tax Assessment Tax Assessment Total Assessment is a certain percentage of the fair market value that is determined by local assessors to be the total taxable value of land and additions on the property. | Land | Improvement |
|---|---|---|---|---|
| 2025 | $4,182 | $32,340 | $13,020 | $19,320 |
| 2024 | $4,182 | $32,040 | $13,020 | $19,020 |
| 2023 | $4,229 | $32,400 | $13,020 | $19,380 |
| 2022 | $4,053 | $31,200 | $13,020 | $18,180 |
| 2021 | $4,103 | $29,880 | $13,020 | $16,860 |
| 2020 | $1,924 | $27,180 | $13,020 | $14,160 |
| 2019 | $3,630 | $25,800 | $13,020 | $12,780 |
| 2018 | $3,537 | $17,352 | $8,405 | $8,947 |
| 2017 | $3,449 | $16,920 | $11,844 | $5,076 |
| 2016 | $3,248 | $16,246 | $12,866 | $3,380 |
| 2015 | $1,925 | $15,327 | $10,629 | $4,698 |
| 2014 | $1,925 | $14,460 | $10,860 | $3,600 |
Source: Public Records
Map
Nearby Homes
- 797 Mother Gaston Blvd
- 258 Lott Ave
- 587 Osborn St
- 555 Christopher Ave
- 578 Christopher Ave
- 699 Sackman St
- 504 Thatford Ave
- 923 Rockaway Ave
- 546 Powell St
- 892 Mother Gaston Blvd
- 563 Powell St
- 632 Osborn St
- 524 Chester St
- 124 Lott Ave
- 664 Osborn St Unit 1
- 546 Bristol St
- 931 Thomas S Boyland St
- 442 Newport St
- 584 Hinsdale St
- 533 Snediker Ave
- 543 Watkins St
- 547 Watkins St
- 541 Watkins St
- 549 Watkins St
- 537 Watkins St
- 551 Watkins St
- 535 Watkins St
- 553 Watkins St
- 533 Watkins St
- 555 Watkins St
- 792 Mother Gaston Blvd
- 790 Mother Gaston Blvd
- 794 Mother Gaston Blvd
- 788 Mother Gaston Blvd
- 531 Watkins St
- 796 Mother Gaston Blvd
- 557 Watkins St
- 784 Mother Gaston Blvd
- 798 Mother Gaston Blvd
- 782 Mother Gaston Blvd