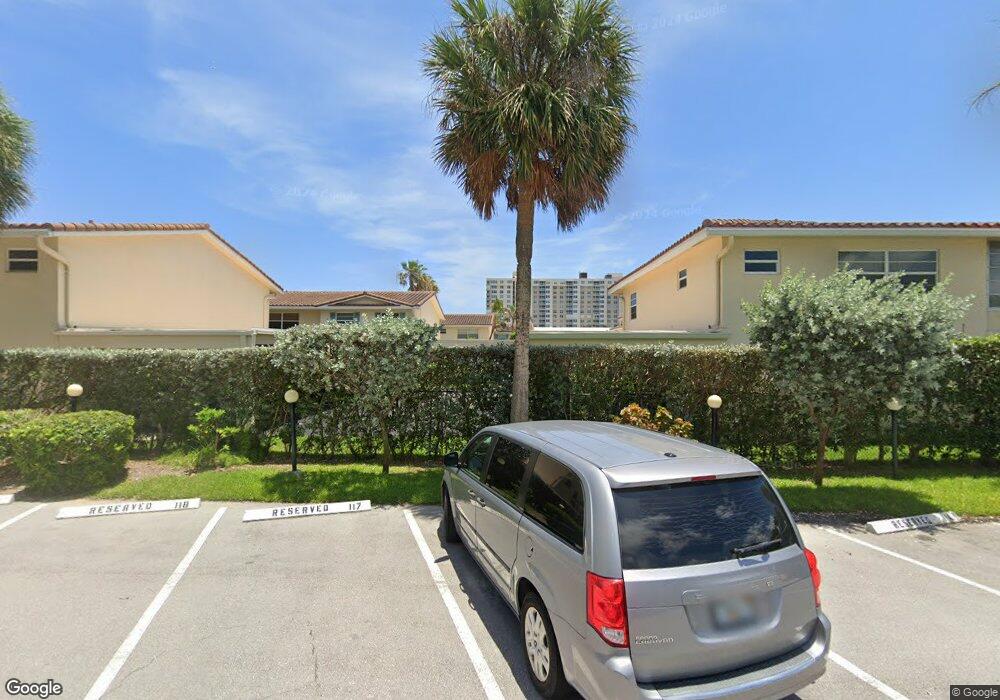
Atlantic Beach Villas 5450 N Ocean Blvd Unit 41K Lauderdale By the Sea, FL 33308
Estimated Value: $551,020 - $683,000
2
Beds
3
Baths
1,500
Sq Ft
$399/Sq Ft
Est. Value
About This Home
This home is located at 5450 N Ocean Blvd Unit 41K, Lauderdale By the Sea, FL 33308 and is currently estimated at $597,755, approximately $398 per square foot. 5450 N Ocean Blvd Unit 41K is a home located in Broward County with nearby schools including McNab Elementary School, Pompano Beach Middle School, and Northeast High School.
Ownership History
Date
Name
Owned For
Owner Type
Purchase Details
Closed on
Sep 27, 2016
Sold by
Abdinoor George F and Abdinoor Barbara A
Bought by
Abdinoor Barbara A
Current Estimated Value
Purchase Details
Closed on
Sep 1, 2016
Bought by
George F Abdinoor Rev Tr
Purchase Details
Closed on
Dec 17, 2007
Sold by
English Heidi M
Bought by
Abdinoor George F and Abdinoor Barbara A
Purchase Details
Closed on
Dec 14, 1998
Sold by
Brescka Polly S and Brescka William P
Bought by
English Martin R and English Heidi M
Home Financials for this Owner
Home Financials are based on the most recent Mortgage that was taken out on this home.
Original Mortgage
$136,000
Interest Rate
6.84%
Mortgage Type
New Conventional
Purchase Details
Closed on
Jul 24, 1995
Sold by
Brescka Polly S and Brescka William P
Bought by
Brescka Polly S and Brescka William P
Purchase Details
Closed on
Nov 1, 1992
Sold by
Available Not
Bought by
Available Not
Create a Home Valuation Report for This Property
The Home Valuation Report is an in-depth analysis detailing your home's value as well as a comparison with similar homes in the area
Home Values in the Area
Average Home Value in this Area
Purchase History
| Date | Buyer | Sale Price | Title Company |
|---|---|---|---|
| Abdinoor Barbara A | -- | Attorney | |
| George F Abdinoor Rev Tr | $100 | -- | |
| Abdinoor George F | $299,000 | Attorney | |
| English Martin R | $170,000 | -- | |
| Brescka Polly S | -- | -- | |
| Available Not | $133,500 | -- |
Source: Public Records
Mortgage History
| Date | Status | Borrower | Loan Amount |
|---|---|---|---|
| Previous Owner | English Martin R | $136,000 |
Source: Public Records
Tax History Compared to Growth
Tax History
| Year | Tax Paid | Tax Assessment Tax Assessment Total Assessment is a certain percentage of the fair market value that is determined by local assessors to be the total taxable value of land and additions on the property. | Land | Improvement |
|---|---|---|---|---|
| 2025 | $8,160 | $436,870 | -- | -- |
| 2024 | $7,662 | $436,870 | -- | -- |
| 2023 | $7,662 | $361,060 | $0 | $0 |
| 2022 | $6,197 | $328,240 | $0 | $0 |
| 2021 | $5,399 | $298,400 | $29,840 | $268,560 |
| 2020 | $5,359 | $295,300 | $29,530 | $265,770 |
| 2019 | $5,305 | $290,100 | $29,010 | $261,090 |
| 2018 | $4,958 | $273,430 | $27,340 | $246,090 |
| 2017 | $4,997 | $270,830 | $0 | $0 |
| 2016 | $5,258 | $271,890 | $0 | $0 |
| 2015 | $5,327 | $247,180 | $0 | $0 |
| 2014 | $4,516 | $224,710 | $0 | $0 |
| 2013 | -- | $256,630 | $25,660 | $230,970 |
Source: Public Records
About Atlantic Beach Villas
Map
Nearby Homes
- 6000 N Ocean Blvd Unit 6E
- 6000 N Ocean Blvd Unit 16E
- 6000 N Ocean Blvd Unit 4F
- 6000 N Ocean Blvd Unit 4E
- 6000 N Ocean Blvd Unit 16D
- 5400 N Ocean Blvd Unit 31H
- 5400 N Ocean Blvd Unit 1
- 5400 N Ocean Blvd Unit 32H
- 2 Mendota Ln
- 2000 S Ocean Blvd Unit 2L
- 2000 S Ocean Blvd Unit 16N
- 2000 S Ocean Blvd Unit L
- 2000 S Ocean Blvd Unit 7J
- 2000 S Ocean Blvd Unit 3L
- 6 Tahoe Ln
- 5200 N Ocean Blvd Unit 315
- 5200 N Ocean Blvd Unit 710B
- 5200 N Ocean Blvd Unit 1207B
- 9 Tahoe Ln
- 2039 Oceanwalk Terrace Unit 401
- 5450 N Ocean Blvd
- 5450 N Ocean Blvd Unit 60N
- 5450 N Ocean Blvd Unit 56N
- 5450 N Ocean Blvd Unit 58N
- 5450 N Ocean Blvd Unit 44L
- 5450 N Ocean Blvd Unit 39K
- 5450 N Ocean Blvd Unit 61N
- 5450 N Ocean Blvd Unit 53M
- 5450 N Ocean Blvd Unit 20F
- 5450 N Ocean Blvd Unit 24F
- 5450 N Ocean Blvd Unit 32J
- 5450 N Ocean Blvd Unit 27H
- 5450 N Ocean Blvd Unit 59N
- 5450 N Ocean Blvd Unit 45l
- 5450 N Ocean Blvd Unit 7C
- 5450 N Ocean Blvd Unit 18E
- 5450 N Ocean Blvd Unit 4A
- 5450 N Ocean Blvd Unit 48L
- 5450 N Ocean Blvd Unit 33J