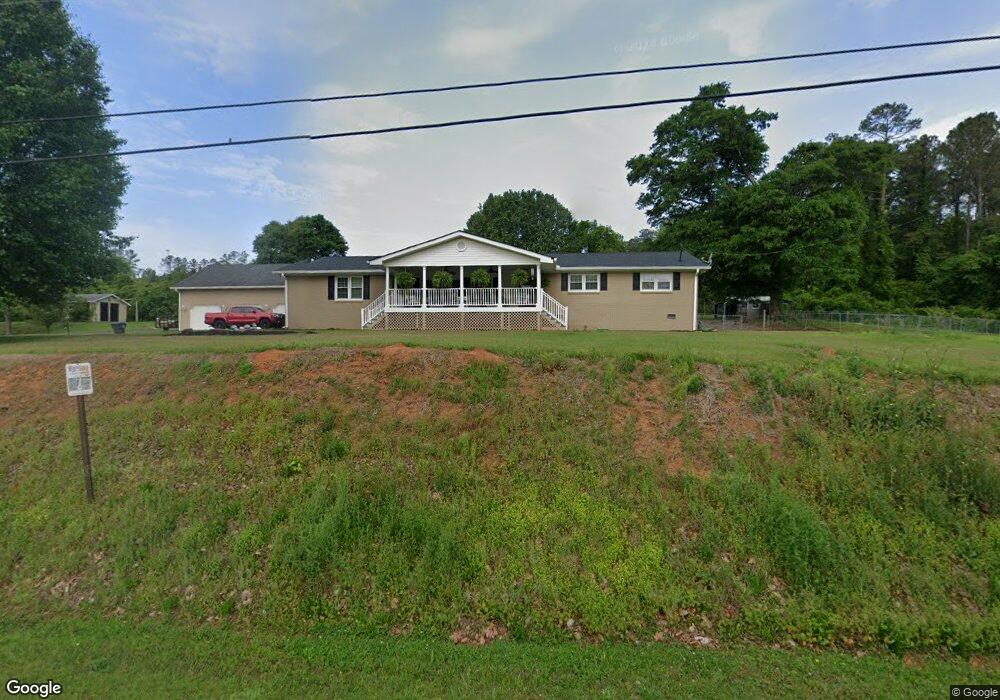
5452 Fosters Mill Rd SW Cave Spring, GA 30124
Estimated Value: $242,000 - $308,000
--
Bed
--
Bath
2,092
Sq Ft
$133/Sq Ft
Est. Value
About This Home
This home is located at 5452 Fosters Mill Rd SW, Cave Spring, GA 30124 and is currently estimated at $279,160, approximately $133 per square foot. 5452 Fosters Mill Rd SW is a home located in Floyd County with nearby schools including Coosa Middle School and Coosa High School.
Ownership History
Date
Name
Owned For
Owner Type
Purchase Details
Closed on
Feb 9, 2006
Sold by
Henderson Kenneth R and Henderson Patsy N
Bought by
Cole Steven A
Current Estimated Value
Home Financials for this Owner
Home Financials are based on the most recent Mortgage that was taken out on this home.
Original Mortgage
$134,095
Outstanding Balance
$74,952
Interest Rate
6.08%
Mortgage Type
FHA
Estimated Equity
$204,208
Purchase Details
Closed on
Dec 28, 2001
Sold by
Heap James W and Heap Amy M
Bought by
Henderson Kenneth R and Hende Patsy N
Purchase Details
Closed on
Mar 11, 1996
Sold by
Bing Larry S and Bing Patricia L
Bought by
Heap James W and Heap Amy M
Purchase Details
Closed on
Jun 11, 1975
Sold by
Redding J Gary
Bought by
Bing Larry S and Bing Patricia L
Purchase Details
Closed on
Dec 3, 1973
Sold by
L & M Development Co
Bought by
Redding J Gary
Purchase Details
Closed on
Oct 10, 1972
Bought by
L & M Development Co
Create a Home Valuation Report for This Property
The Home Valuation Report is an in-depth analysis detailing your home's value as well as a comparison with similar homes in the area
Home Values in the Area
Average Home Value in this Area
Purchase History
| Date | Buyer | Sale Price | Title Company |
|---|---|---|---|
| Cole Steven A | $128,700 | -- | |
| Cole Steven A | $7,491 | -- | |
| Henderson Kenneth R | $94,300 | -- | |
| Heap James W | $80,000 | -- | |
| Bing Larry S | $33,500 | -- | |
| Redding J Gary | $3,000 | -- | |
| L & M Development Co | -- | -- |
Source: Public Records
Mortgage History
| Date | Status | Borrower | Loan Amount |
|---|---|---|---|
| Open | Cole Steven A | $134,095 | |
| Closed | Cole Steven A | $134,095 |
Source: Public Records
Tax History Compared to Growth
Tax History
| Year | Tax Paid | Tax Assessment Tax Assessment Total Assessment is a certain percentage of the fair market value that is determined by local assessors to be the total taxable value of land and additions on the property. | Land | Improvement |
|---|---|---|---|---|
| 2024 | $2,505 | $115,621 | $8,389 | $107,232 |
| 2023 | $2,482 | $114,043 | $7,190 | $106,853 |
| 2022 | $2,283 | $98,938 | $5,992 | $92,946 |
| 2021 | $2,062 | $84,532 | $5,992 | $78,540 |
| 2020 | $1,513 | $58,274 | $4,794 | $53,480 |
| 2019 | $1,454 | $56,087 | $4,794 | $51,293 |
| 2018 | $1,410 | $53,789 | $4,794 | $48,995 |
| 2017 | $1,380 | $52,572 | $4,794 | $47,778 |
| 2016 | $1,110 | $42,408 | $4,760 | $37,648 |
| 2015 | $1,085 | $42,408 | $4,760 | $37,648 |
| 2014 | $1,085 | $42,408 | $4,760 | $37,648 |
Source: Public Records
Map
Nearby Homes
- 5549 Fosters Mill Rd SW
- 79 Mill St SW
- 57 Mill St
- 22 River St SW
- 4 Church St
- 1 Heather Cir
- 7 Herschel Mize Dr
- 7 Herschel Mize Dr SW
- 6 River St SW
- 10,12,14 & 16 Park St
- 12 Park St
- 4720 Fosters Mill Rd SW
- 0 Jackson Chapel Rd SW Unit 23799655
- 10 Ridge Rd SW
- 907 Gadsden Rd SW
- 0 McGee Bend Rd SW Unit 10351960
- 0 Blacks Bluff Rd SW Unit 7655536
- 0 Blacks Bluff Rd SW Unit 10449213
- 0 Buttermilk Rd SW Unit 10462359
- 0 Buttermilk Rd SW Unit 7527264
- 5452 Fosters Mill Rd SW
- 5472 Fosters Mill Rd SW
- 5435 Fosters Mill Rd SW
- 5455 Fosters Mill Rd SW
- 5477 Fosters Mill Rd SW
- 5497 Fosters Mill Rd SW
- 5511 Fosters Mill Rd SW
- 5530 Fosters Mill Rd SW
- 5533 Fosters Mill Rd SW
- 5544 Fosters Mill Rd SW
- 5558 Fosters Mill Rd SW
- 5324 Fosters Mill Rd SW Unit B
- 5324 Fosters Mill Rd SW Unit 1
- 5324 Fosters Mill Rd SW
- 5576 Fosters Mill Rd SW
- 5569 Fosters Mill Rd SW
- 5605 Fosters Mill Rd SW
- 5595 Fosters Mill Rd SW
- 5606 Fosters Mill Rd SW
- 5305 Fosters Mill Rd SW