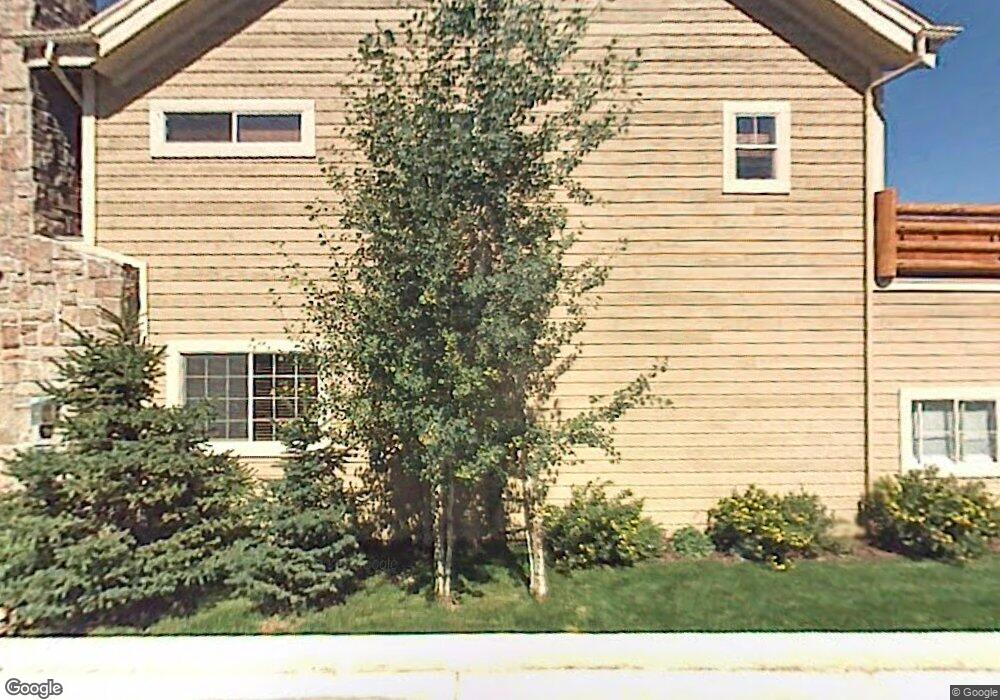
5453 N Biathalon Loop T43 Unit T43 Park City, UT 84098
Estimated Value: $1,138,000 - $1,394,000
3
Beds
3
Baths
1,961
Sq Ft
$658/Sq Ft
Est. Value
About This Home
This home is located at 5453 N Biathalon Loop T43 Unit T43, Park City, UT 84098 and is currently estimated at $1,291,033, approximately $658 per square foot. 5453 N Biathalon Loop T43 Unit T43 is a home located in Summit County with nearby schools including Parley's Park Elementary School, Ecker Hill Middle School, and Treasure Mountain Junior High School.
Ownership History
Date
Name
Owned For
Owner Type
Purchase Details
Closed on
Aug 24, 2020
Sold by
Sander Thomas W and Sander Alice A
Bought by
Ouaking Aspen Cabin Llc
Current Estimated Value
Purchase Details
Closed on
Aug 9, 2013
Sold by
Silverii Marlen and Silverii Candice
Bought by
Sander Thomas W and Sander Alice A
Purchase Details
Closed on
May 29, 2007
Sold by
Silverii Marlen A and Silverii Candice A
Bought by
Silverii Marlen and Silverii Candice
Purchase Details
Closed on
Sep 8, 2005
Sold by
Manilla Andrew George and Manilla Christy Johns
Bought by
Silverli Marlen R and Silverli Candice A
Home Financials for this Owner
Home Financials are based on the most recent Mortgage that was taken out on this home.
Original Mortgage
$401,600
Interest Rate
5.75%
Mortgage Type
Adjustable Rate Mortgage/ARM
Create a Home Valuation Report for This Property
The Home Valuation Report is an in-depth analysis detailing your home's value as well as a comparison with similar homes in the area
Home Values in the Area
Average Home Value in this Area
Purchase History
| Date | Buyer | Sale Price | Title Company |
|---|---|---|---|
| Ouaking Aspen Cabin Llc | -- | Real Advantage Title Ins | |
| Sander Thomas W | -- | First American Title | |
| Silverii Marlen | -- | Mid State Title & Escrow Inc | |
| Silverli Marlen R | -- | First American Title |
Source: Public Records
Mortgage History
| Date | Status | Borrower | Loan Amount |
|---|---|---|---|
| Previous Owner | Silverli Marlen R | $401,600 |
Source: Public Records
Tax History Compared to Growth
Tax History
| Year | Tax Paid | Tax Assessment Tax Assessment Total Assessment is a certain percentage of the fair market value that is determined by local assessors to be the total taxable value of land and additions on the property. | Land | Improvement |
|---|---|---|---|---|
| 2024 | $6,355 | $632,500 | $137,500 | $495,000 |
| 2023 | $6,355 | $1,150,000 | $250,000 | $900,000 |
| 2022 | $5,807 | $930,000 | $250,000 | $680,000 |
| 2021 | $542 | $750,000 | $250,000 | $500,000 |
| 2020 | $5,344 | $710,000 | $250,000 | $460,000 |
| 2019 | $4,308 | $302,500 | $137,500 | $165,000 |
| 2018 | $4,308 | $550,000 | $250,000 | $300,000 |
| 2017 | $3,983 | $550,000 | $250,000 | $300,000 |
| 2016 | $3,815 | $490,000 | $190,000 | $300,000 |
| 2015 | $3,456 | $420,000 | $0 | $0 |
| 2013 | $3,212 | $370,000 | $0 | $0 |
Source: Public Records
Map
Nearby Homes
- 5501 Bobsled Blvd Unit T31
- 5452 Bobsled Blvd
- 5428 Bobsled Blvd
- 5541 N Slalom Way
- 5519 Lillehammer Ln Unit 1406
- 5519 Lillehammer Ln Unit 1206
- 5519 Lillehammer Ln Unit 1201
- 5596 Oslo Ln
- 5663 Bobsled Blvd
- 5221 Cove Canyon Dr Unit B
- 5134 Heather Ln
- 5150 Cove Canyon Dr Unit A
- 5150 Cove Canyon Dr Unit A
- 1508 Fletcher Ct
- 6042 N Fox Pointe Cir Unit C1
- 6095 N Fox Point Cir Unit B 1
- 6010 N Fox Pointe Cir Unit B1
- 5962 Park Ln S Unit 92
- 1646 Fox Hollow Ln Unit G5
- 5453 Biathlon Loop
- 5453 Biathlon Loop Unit 43
- 5455 Biathlon Loop
- 5455 Biathlon Loop Unit T42
- 5455 Biathlon Loop Unit 4
- 5455 N Biathalon Loop T42 Unit T42
- 5457 Biathlon Loop
- 5446 Lillehammer Ln
- 5446 Lillehammer Ln Unit T45
- 5448 Lillehammer Ln
- 5448 Lillehammer Ln Unit T-46
- 5442 Lillehammer Ln
- 5442 Lillehammer Ln Unit T-44
- 5464 Luge Ln
- 5464 Luge Ln Unit T49
- 5466 Luge Ln
- 5466 Luge Ln Unit T50
- 5468 Luge Ln
- 5468 Luge Ln Unit T51
- 5462 Luge Ln