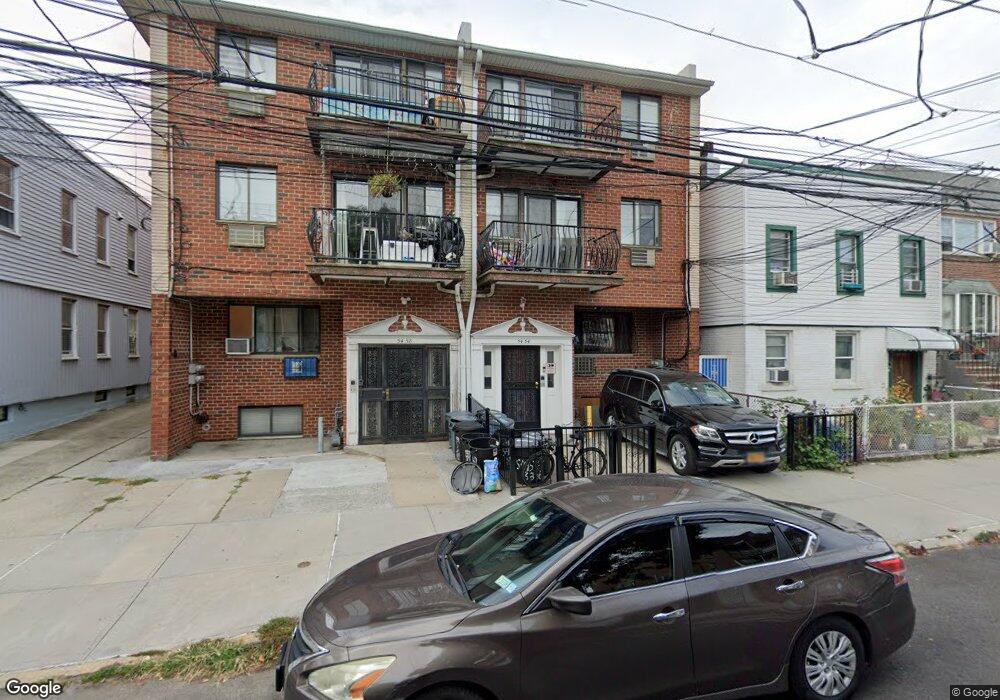
5454 83rd St Elmhurst, NY 11373
Maspeth NeighborhoodEstimated Value: $1,698,000 - $1,826,000
--
Bed
--
Bath
3,240
Sq Ft
$540/Sq Ft
Est. Value
About This Home
This home is located at 5454 83rd St, Elmhurst, NY 11373 and is currently estimated at $1,749,000, approximately $539 per square foot. 5454 83rd St is a home located in Queens County with nearby schools including Ps 58 School Of Heroes, IS 73 - The Frank Sansivieri School, and Newtown High School.
Ownership History
Date
Name
Owned For
Owner Type
Purchase Details
Closed on
May 12, 2022
Sold by
Cheng Kwai Fong and Tung Mary Yuk
Bought by
Cheng Hok Kam and Lau Ie Ting
Current Estimated Value
Home Financials for this Owner
Home Financials are based on the most recent Mortgage that was taken out on this home.
Original Mortgage
$1,000,000
Outstanding Balance
$950,402
Interest Rate
5.3%
Mortgage Type
Purchase Money Mortgage
Estimated Equity
$798,598
Purchase Details
Closed on
Aug 29, 2013
Sold by
Zheng Gui Fen and Kwai Fong Cheng
Bought by
Tung Mary Yuk Yu and Tung Tsui Kwan
Home Financials for this Owner
Home Financials are based on the most recent Mortgage that was taken out on this home.
Original Mortgage
$500,000
Interest Rate
4.43%
Mortgage Type
New Conventional
Purchase Details
Closed on
Jul 13, 1994
Sold by
Tung Hau Kei and Zheng Gui Fen
Bought by
Zheng Gui Fen
Create a Home Valuation Report for This Property
The Home Valuation Report is an in-depth analysis detailing your home's value as well as a comparison with similar homes in the area
Home Values in the Area
Average Home Value in this Area
Purchase History
| Date | Buyer | Sale Price | Title Company |
|---|---|---|---|
| Cheng Hok Kam | $1,570,000 | -- | |
| Cheng Hok Kam | $1,570,000 | -- | |
| Tung Mary Yuk Yu | -- | -- | |
| Tung Mary Yuk Yu | -- | -- | |
| Zheng Gui Fen | -- | Title Usa Insurance Corp | |
| Zheng Gui Fen | -- | Title Usa Insurance Corp |
Source: Public Records
Mortgage History
| Date | Status | Borrower | Loan Amount |
|---|---|---|---|
| Open | Cheng Hok Kam | $1,000,000 | |
| Closed | Cheng Hok Kam | $1,000,000 | |
| Closed | Tung Mary Yuk Yu | $500,000 |
Source: Public Records
Tax History Compared to Growth
Tax History
| Year | Tax Paid | Tax Assessment Tax Assessment Total Assessment is a certain percentage of the fair market value that is determined by local assessors to be the total taxable value of land and additions on the property. | Land | Improvement |
|---|---|---|---|---|
| 2025 | $15,033 | $78,630 | $22,514 | $56,116 |
| 2024 | $15,033 | $74,848 | $21,287 | $53,561 |
| 2023 | $14,507 | $72,230 | $18,883 | $53,347 |
| 2022 | $10,737 | $98,820 | $27,780 | $71,040 |
| 2021 | $14,617 | $91,860 | $27,780 | $64,080 |
| 2020 | $13,870 | $91,020 | $27,780 | $63,240 |
| 2019 | $13,048 | $90,780 | $27,780 | $63,000 |
| 2018 | $12,270 | $60,192 | $19,448 | $40,744 |
| 2017 | $12,182 | $59,760 | $22,791 | $36,969 |
| 2016 | $11,571 | $59,760 | $22,791 | $36,969 |
| 2015 | -- | $54,604 | $25,987 | $28,617 |
| 2014 | -- | $51,978 | $29,685 | $22,293 |
Source: Public Records
Map
Nearby Homes
- 5434 83rd St
- 52-57 84th St
- 8318 58th Ave
- 55-08 Haspel St
- 84-24 57th Rd
- 5810 83rd Place
- 8230 58th Ave
- 5323 82nd St
- 58-25 83rd St
- 53-16 Haspel St
- 85-21 56th Ave
- 79-10 Grand Ave
- 85-30 57th Ave Unit 1A
- 76-22 57th Rd
- 84-26 60th Ave
- 84-38 Grand Ave
- 8426 60th Ave
- 58-05 Van Horn St
- 86-20 57th Rd
- 5853 79th St